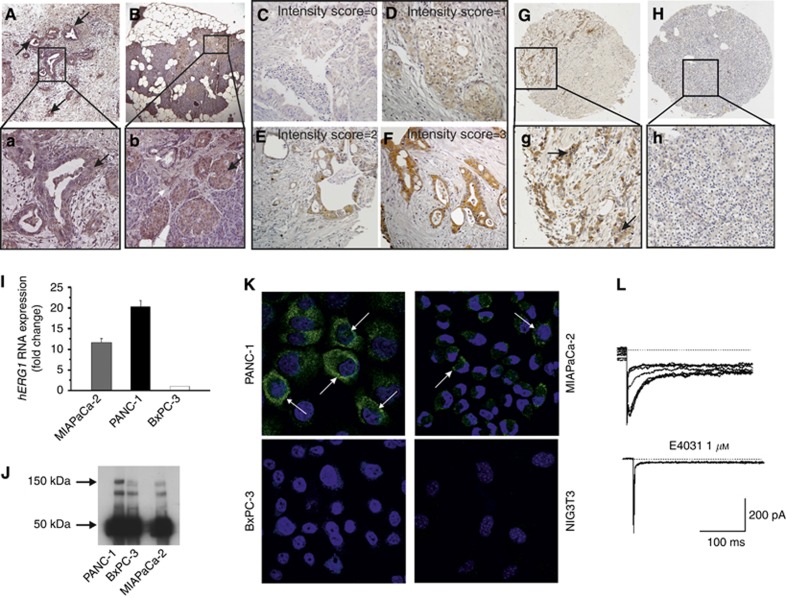
Figure 1.
hERG1 expression in PDAC primary samples. (A) IHC for hERG1 in a PDAC sample. Magnification: 50x; a: higher magnification (200x) of the area in the black box in panel A. Arrow indicate hERG1 immunostaining at the cytoplasmic level. (B) IHC for hERG1 in a healthy pancreas. Magnification: 50x; b: higher magnification (200x) of the area in the black box in panel B. The black arrow indicates the hERG1 immunostaining in Langerhans islets, mainly attributable to the expression in beta cells; the white arrows indicate the lack of expression in the pancreatic stroma, as well as in normal ductal epithelial cells. (C–F) Representative microphotographs of samples showing different hERG1 intensity are reported; E: intensity score=0; F: intensity score=1; G: intensity score=2; H: intensity score=3. Magnification: 400x. (G) IHC for hERG1 in a PDAC sample assembled in TMA. Magnification: 50x; g: higher magnification of the area in the black box in panel G. (H) IHC for hERG1 protein in the corresponding healthy pancreatic tissue of panel G. Magnification: 50x. (I) Expression of hERG1 RNA. hERG1 transcript levels were normalised to the β-actin gene. (J) Expression of hERG1 protein: immunoprecipitation data. Two miligrams of total cell lysates were immunoprecipitated with the α-hERG1-MoAb and the corresponding blots were probed with a polyclonal antibody directed against the hERG1 C-terminus (C54 antibody). The 150 kDa band (arrow) corresponds to the mature, fully glycosylated hERG1 protein; the lower band (135 kDa) represents the partially glycosylated, immature hERG1 protein; the 50 kDa band (arrow) corresponds to the Ig used for the immunoprecipitation. (K) Expression of hERG1 protein: immunofluorescence data. In the merged images here reported, the green signal indicates the presence of hERG1 protein at the plasma membrane and cytoplasmic levels, whereas nuclei are stained in blue by DAPI. Magnification: 60x. (L) hERG1 current in PDAC (MIAPaCa-2) cells. Current traces (left panel) are sensitive to the specific hERG1 blocker E4031 (right panel).

