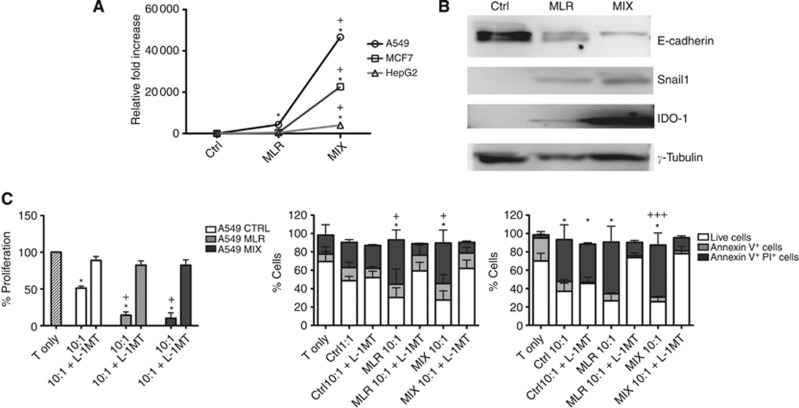
Figure 5.
Involvement of IDO. (A) ido1 gene expression in A549 (circle), MCF7 (square) and HepG2 (triangle) cells at basal conditions (CTRL) and after EMT induction with MLR or MIX priming. Graph lines show the relative fold increase expression of ido1. (B) Representative protein expression of E-cadherin, Snail1, Ido1 and γ-tubulin in A549, MCF7 and HepG2 at basal condition (CTRL) and after EMT induction with MLR or MIX priming. (C) The effect of IDO inhibitor (L-1MT) on T cells, taking into consideration that A549 mainly inhibit T-cell proliferation without inducing significant apoptosis, while MCF7 and HepG2 have a prevalent pro-apoptotic effect on T cells: Left histograms: viable T-cell proliferation rate in presence of A549 cells with or without L-1MT addition (striped column: T cells only; white column: T cells co-cultured with cancer cells at basal conditions; grey column: T cells co-cultured with MLR-primed cancer cells; black column: T co-cultured with MIX-primed cancer cells). Middle histograms: T-cell viability in presence of MCF7 cells with or without L-1MT addition (white bar: viable T cells; grey bar: annexin V+ cells; black bar: annexin V+/PI+ cells); Right histograms: T-cell viability in the presence of HepG2 cells with or without L-1MT addition (white bar: viable T cells; grey bar: annexin V+ cells; black bar: annexin V+/PI+ cells). Error bars: s.d. Statistical significance compared with basal condition (T-cell only): *P<0.01; **P<0.03; ***P<0.05. Statistical significance compared with cancer cell CTRL condition: +P<0.01; ++P<0.03; +++P<0.05.

