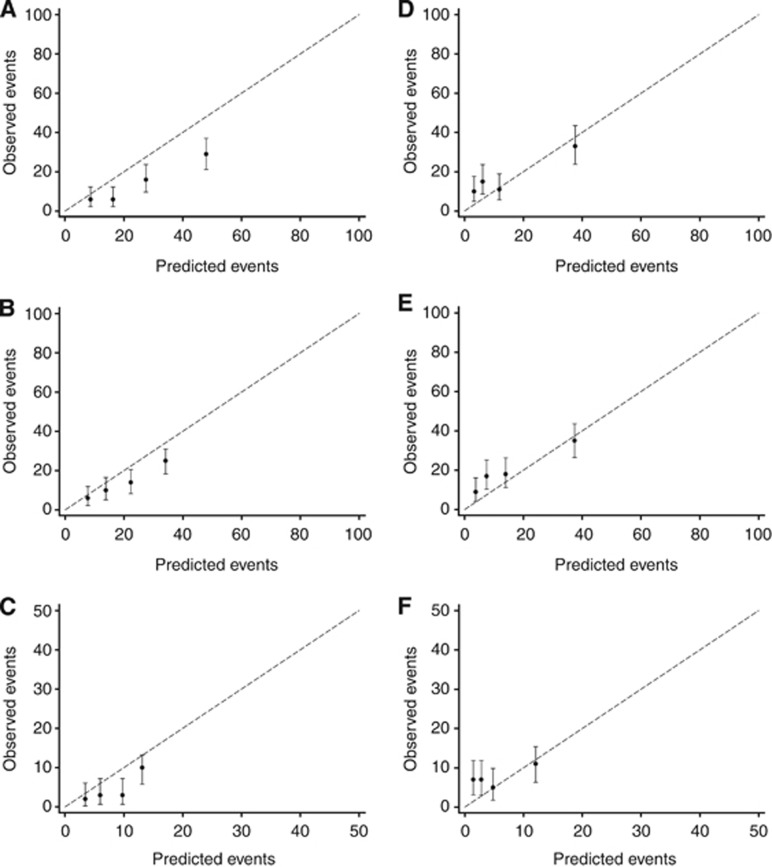
Figure 3.
Calibrations plots of observed OS outcomes with 95% confidence intervals against predicted outcomes by quartiles of the predicted risk for HER2+ patients only, by ER status. OS outcomes for patients with ER− tumours at (A) 5 years, (B) 8 years, and (C) 10 years, and OS outcomes for patients with ER+ tumours at (D) 5 years, (E) 8 years, and (F) 10 years.

