Table 2.
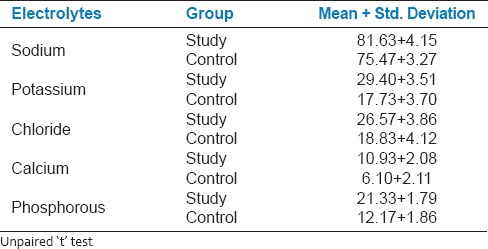
Comparison of salivary electrolytes in mg/dl (sodium, potassium, chloride, calcium, phosphorous) in study and control group

Comparison of salivary electrolytes in mg/dl (sodium, potassium, chloride, calcium, phosphorous) in study and control group
