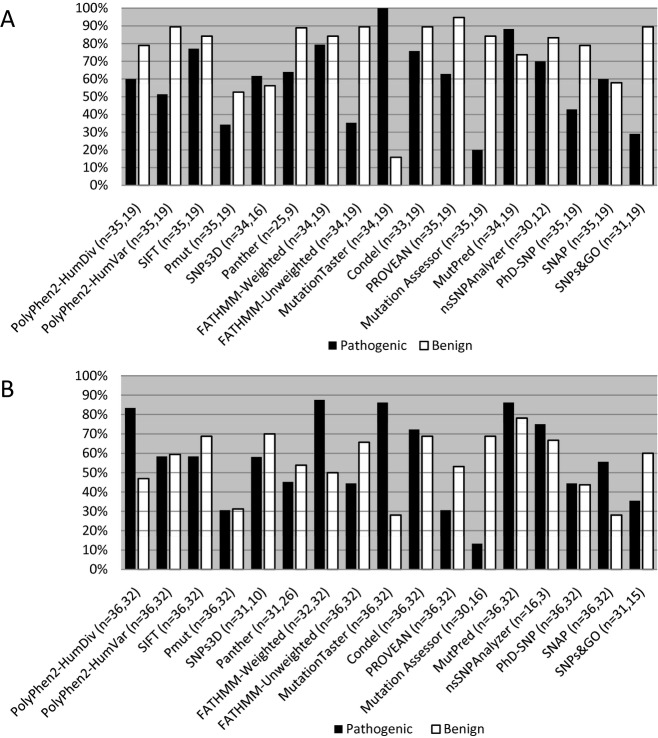
Figure 2.
Percentage of correct predictions. The ability of the prediction programs to correctly assign either pathogenic (black) or benign (white) status to variants in the RASopathy dataset (A) and the LGMD dataset (B) is shown. The program used and the number of variants with prediction outputs (pathogenic, benign) are listed below the graph. Percentages were generated by dividing the number of variants predicted correctly by the number of variants with prediction outputs for each class (pathogenic or benign). The RASopathy dataset contained 35 credibly pathogenic variants and 19 credibly benign variants. The LGMD dataset contained 36 credibly pathogenic variants and 32 credibly benign variants.

