Figure 1.
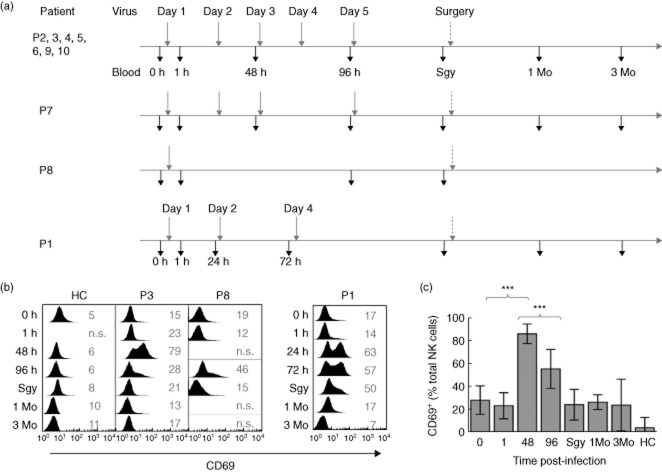
Human natural killer (NK) cell activation by reovirus in vivo. (a) Schedule of patient infection and sampling during the reovirus clinical trial. Four different schedules were employed. Patients (P) 2, 3, 4, 5, 6, 9 and 10 were treated according to the schedule shown at the top. The variations for P7, P8 and P1 are shown below. The time of infection is shown above the horizontal line (grey vertical arrow) and the time of blood sampling below (black vertical arrow). Times of blood sampling (time post-infection) are shown in hours (0, 1, 24, 48, 72, 96), immediately prior to surgery (Sgy) and in months (1 Mo, 3 Mo). The indicated variations were made according to clinical parameters which, together with patient details and timing of the surgery, have been reported previously 25. Each infusion consisted of 1010 units of reovirus, with one unit defined as the dose of virus required to kill 50% of cultured cells in vitro (the tissue culture infective dose 50%, or TCID50). (b) NK cell surface expression of CD69 in selected patients representing key variations to the schedule and in a healthy control (HC); P3 represents the patients with repeated doses, P8 had a single dose and P1 underwent treatment with altered timing to the other patients. The time post-infection is shown with 0 h immediately prior to the first infusion. The values in grey indicate the percentage of CD69 expressing NK cells compared to isotype control stains that were performed for all analyses (not shown). (c) Summary of CD69 expression in patients P2–10 and in healthy control (HC) donors (n = 7). The P-values were calculated using the Mann–Whitney U-test; ***P < 0·001. P1 data are omitted from this analysis because of the altered timing of therapy.

