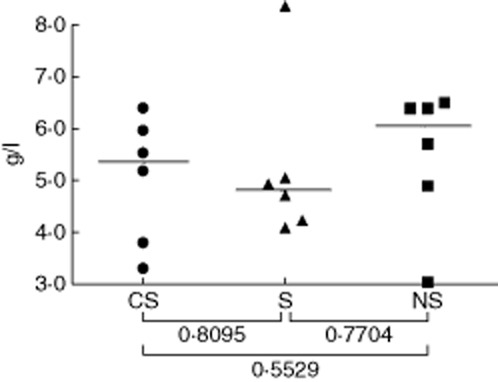
Figure 2.

Total immunoglobulin (Ig)G immunoglobulin levels in sera. Sera from smokers with chronic obstructive pulmonary disease (CS) patients, smokers (S) and non-smokers (NS) were assayed for total IgG levels by nephelometry. Each point represents an individual serum sample, and the horizontal lines are the median IgG concentrations (g/l) of the groups; statistical comparisons between groups were performed using the Mann–Whitney U-test.
