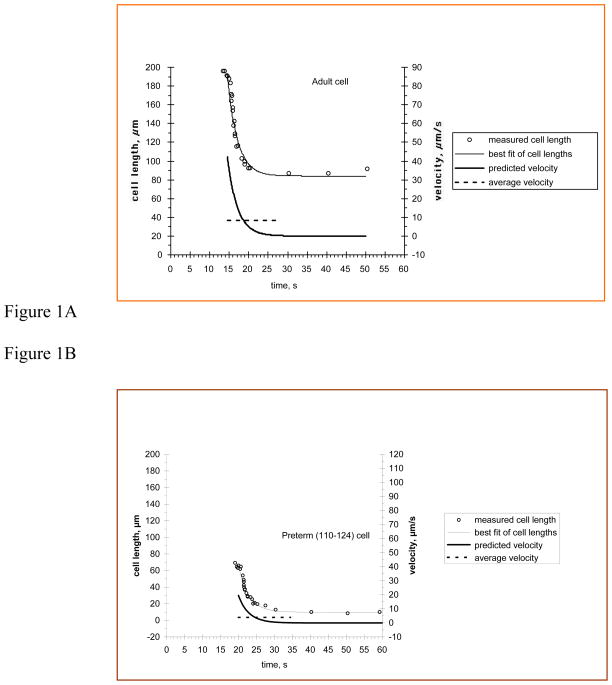
Figure 1. Contraction of ASM cells.
Cell length is plotted as a function of time during shortening. Agonist solution was 100 μM carbachol. Circles represent measured length of the cell at times indicated. The dashed line is the best fit of these points using our exponential model. Solid line represents the average shortening velocity to five time constants and the dashed-dotted line is the predicted maximum shortening velocity. A: An adult cell during contraction. B: A preterm (110–124 days) cell during contraction.

