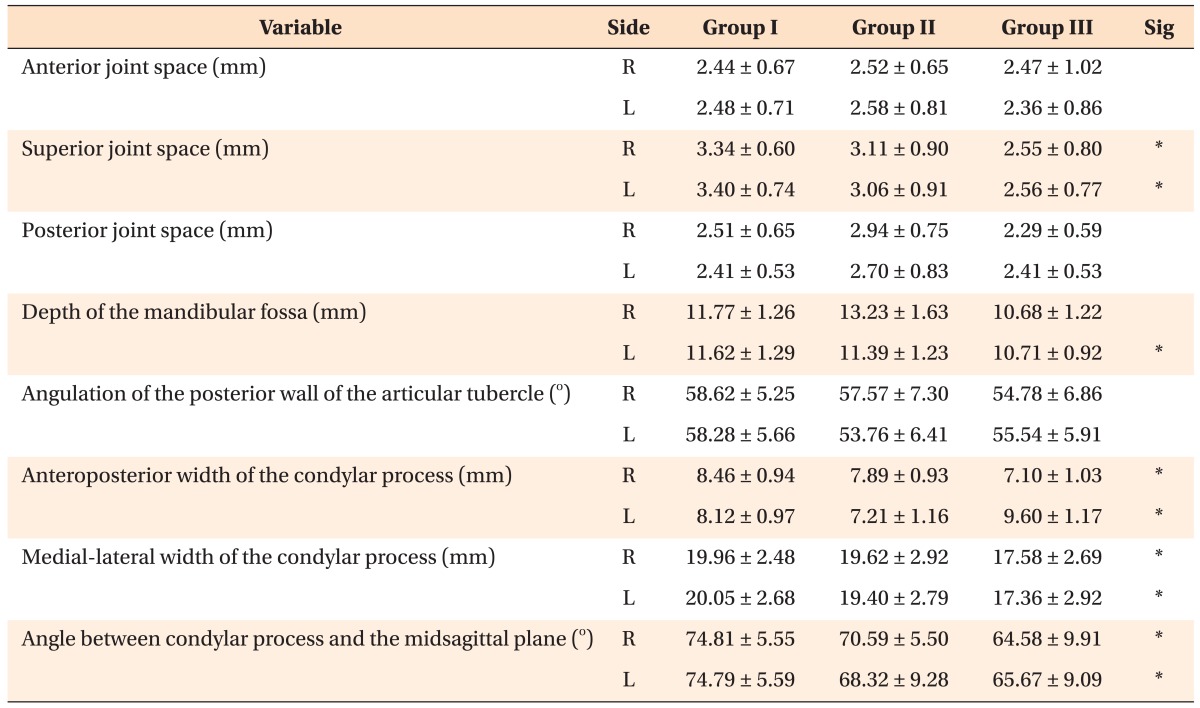
Table 4. Measurements for the variables in all groups.

Values are presented as mean ± standard deviation.
Group I, Hypodivergent; Group II, normodivergent; Group III, hyperdivergent; R, right; L, left.
*p < 0.05, analyzed by one-way ANOVA and level of significance (Sig) among groups.
