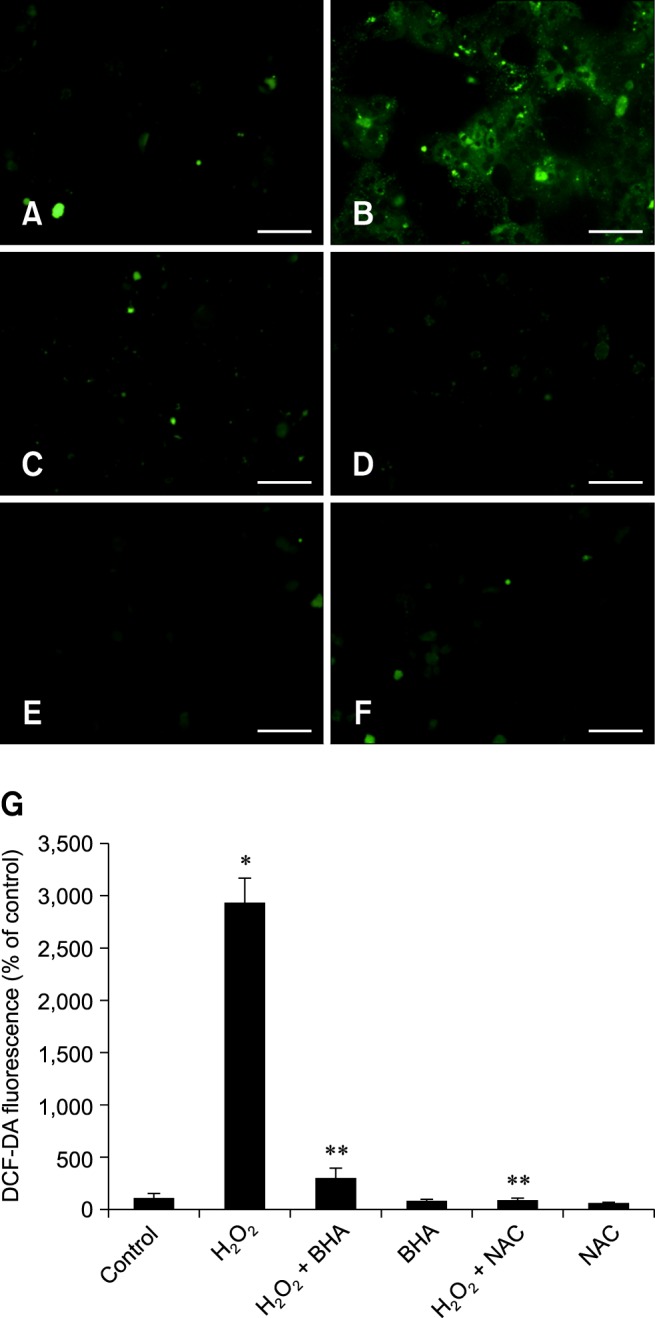
Fig. 3. Effect of BHA on H2O2-induced ROS generation. (A~F) Dichlorofluorescein (DCF)-sensitive cellular ROS generation was assessed. (A) Control. (B) Treatment with 1,000 µM H2O2 for 2 h. (C) Pretreatment with 5 µM BHA for 30 min before exposure to 1,000 µM H2O2 for 2 h. (D) Incubtion with with BHA for 2 h. (E) Pretreatment with 1,000 µM N-acetyl-cysteine (NAC) for 30 min before exposure to 1,000 µM H2O2 for 2 h. (F) Incubation with NAC for 2h. (G) DCF-DA fluorescence was measured and quantified with a fluorometer. Values are expressed as the mean ± SE of three independent experiments. *p < 0.05 vs. the control, **p < 0.05 vs. H2O2 alone. Scale bars = 50 µm (A~F).

