Figure 2.
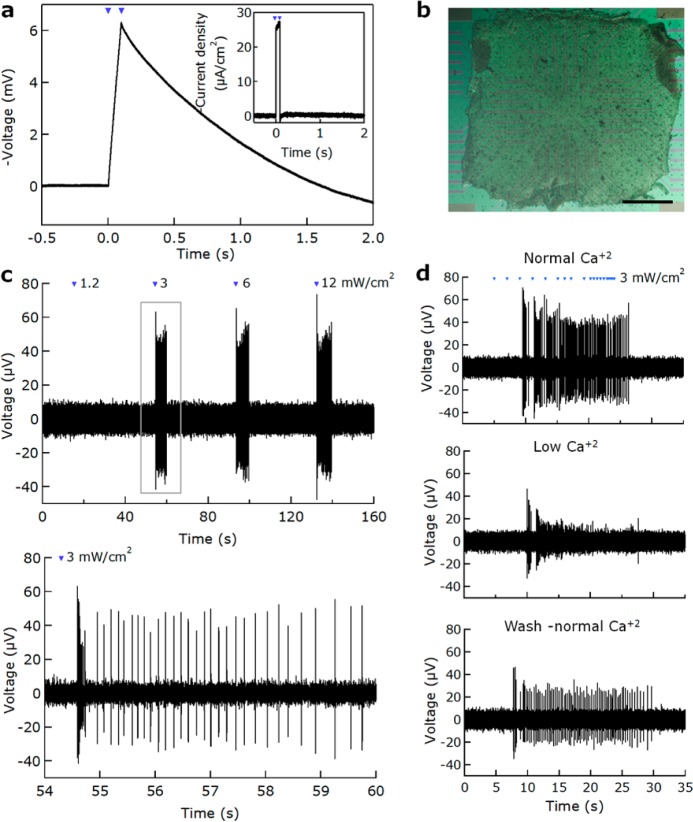
Embryonic chick retina stimulation with NR–CNT electrodes. (a) Photovoltage (negative polarity) of a CdSe/CdS–GSH NR–CNT electrode versus time (electrode diameter 210 μm). Electrodes were illuminated with a violet light source (405 nm) for 100 ms at intensity of 70 mW/cm2. Inset: Photocurrent versus time for the same electrode under the same illumination conditions. (b) A chick retina (E14) placed on a CdSe/CdS–GSH NR–CNT MEA; the scale bar is 500 μm. (c) Extracellular voltage trace (top) recorded from a chick retina following 100 ms light stimulation (405 nm; pulse interval of 30 ms) at different intensities (1.2, 3, 6, and 12 mW/cm2; stimulation pulses are marked by blue arrow heads). The bottom panel is an enlargement of the spike burst following a light pulse of 3 mW/cm2. (d) Extracellular voltage traces recorded from a chick retina under illumination with 3 mW/cm2 and 30 ms pulses (405 nm; marked by blue arrow heads) with different interpulse intervals (2 s, 1 s, 500 ms, 250 ms; repeated five times for each interval) when maintained in a control medium (2.5 mM Ca2+; top), low Ca2+ medium (0.5 mM Ca2+; middle), and measured again in a medium with normal Ca2+ concentration (2.5 mM Ca2+; bottom).

