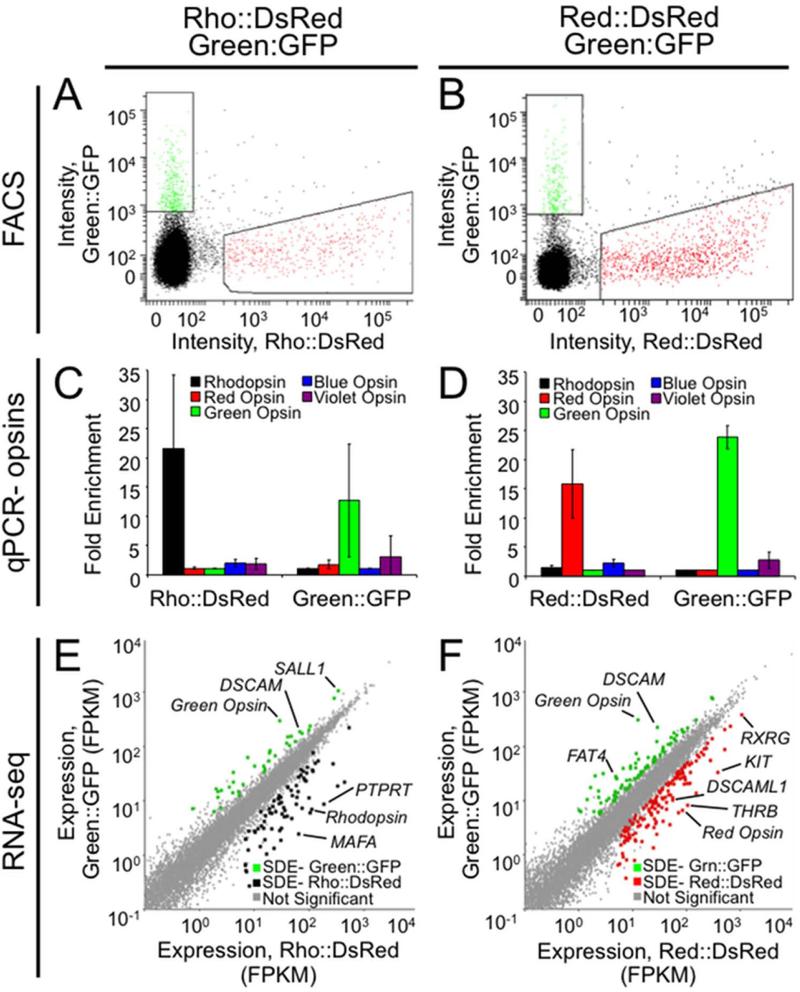
Figure 2.
Expression profiling at an intermediate developmental stage identifies several hundred differentially expressed genes. Retinas were co-electroporated with either Rho::DsRed and Green::GFP (A,C,E) or Red::DsRed and Green::GFP (B,D,F) at embryonic day 6 and cultured in vitro as explants for 9 days. A,B: Six retinas for each of three replicates were dissociated, and FACS was used to isolate fluorescent cells. Gating is shown for a representative replicate for each experiment. C,D: To verify enrichment of desired cell types, qPCR was conducted on amplified cDNA from sorted populations to determine the relative prevalence of opsin transcripts. Fold enrichment has been normalized to GAPDH, and error bars represent the standard deviation between the three biological replicates. E,F: Sequencing data was analyzed using TopHat to determine the expression level for each transcript (fragments per kilobase per million reads, FPKM). Each transcript is represented as a point plotted with expression levels (FPKM) in either Rho::DsRed (E) or Red::DsRed (F) on the x-axis and in Green::GFP on the y-axis. Cuffdiff was used to identify significantly differentially expressed (SDE) genes at 5% FDR. These positive hits were filtered to include only genes also called significant by edgeR, with ≥ 5 FPKM, and with ≥ 2 fold change between populations and are represented as colored dots for Rho::DsRed (E, black), Red::DsRed (F, red) and Green::GFP (E,F green).

