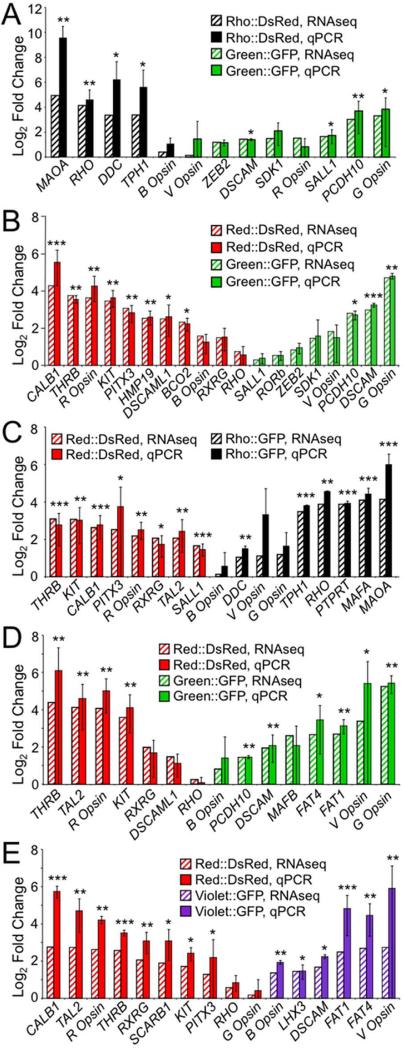
Figure 4.
Strong correlation between fold enrichment based on qPCR and RNA-Seq. For each experiment, differences in expression of ~ 15 genes across a range of fold changes and expression levels were further quantified by qPCR. Results are shown for experiments conducted at both the early time point, A: Rho::DsRed vs. Green::GFP and B: Red::DsRed vs. Green::GFP, and at the later time point, C: Red::DsRed vs. Rho::GFP, D: Red::DsRed vs. Green::GFP, and E: Red::DsRed vs. Violet::GFP. Fold change as calculated by RNA-Seq is shown as striped bars, while fold change as determined by qPCR is shown as solid bars (A-E). Fold enrichment for qPCR was normalized to GAPDH, and qPCR error bars represent 95% confidence intervals based on the standard error of the mean. A two-sided t-test was used to assess significant enrichment in the qPCR data, with p-values indicated as follows: p < 0.05 (*), p < 0.01 (**), and p < 0.001 (***).

