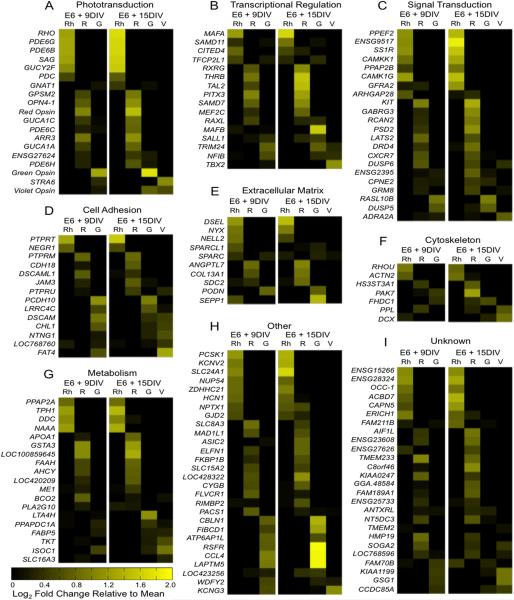
Figure 5.
Differentially expressed genes across all datasets by functional category. Differentially expressed genes were filtered to include those with ≥ 20 average fragments per kilobase per million reads (FPKM) and ≥ 3 fold change and were combined into a single dataset. The average FPKM for each gene at the early and late time points were calculated. Then, the log2 fold change for each population (Rh = Rhodopsin, R = Red Opsin, G = Green Opsin, V = Violet Opsin) relative to the average was calculated and is shown above, with genes expressed at above-average levels shown in increasing yellow intensity (see color bar). Genes were sorted into functional categories using gene ontology (GO) annotation and manual literature search. Categories containing a large proportion of differentially expressed genes include A: phototransduction, B: transcriptional regulation, C: signal transduction, D: cell adhesion, E: extracellular matrix, F: cytoskeleton and G: metabolism. Some gene categories were represented by only a few genes and are grouped together under “other” (H), while the function of other genes is unknown (I).

