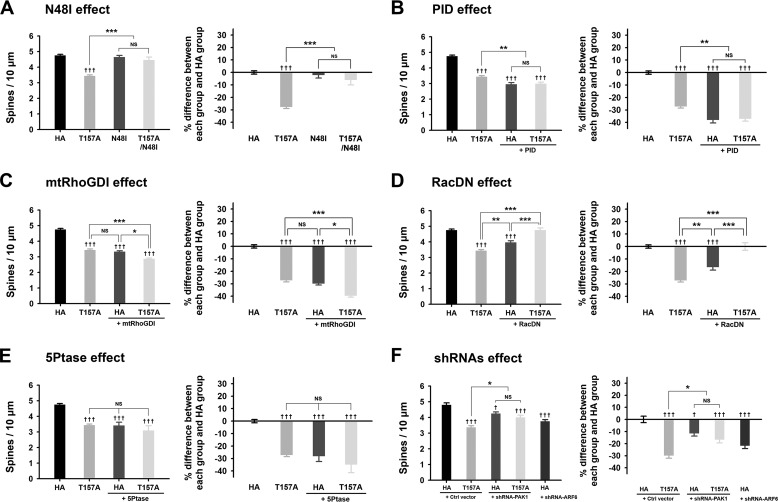
FIGURE 4.
The effects of ARF6-T157A or ARF6 knockdown on dendritic spine formation in mature neurons. A–D, Cultured hippocampal neurons were co-transfected at DIV 16 with T157A-ARF6-HA, T157A/N48I-ARF6-HA, N48I-ARF6-HA, or HA and GFP (A), T157A-ARF6-HA or HA and GFP or GFP-PID (B), T157A-ARF6-HA or HA and GFP or GFP-mtRhoGDI (C), T157A-ARF6-HA or HA and GFP or GFP-RacDN (D), or T157A-ARF6-HA or HA and GFP or GFP-5Ptase (E) and fixed at DIV 20. The effect of ARF6 mutants on dendritic spine formation was quantified to investigate the PLD/PA pathway. The values in the spine number graph were recalculated to show percent differences between each group and HA. Detailed data are shown in Table 2. Data were collected for each group in three independent experiments. The values are means ± S.E. Daggers (†) indicate the significance between HA and each group, and asterisks (*) indicate the significance between each group. ††† and ***, p < 0.001; **, p < 0.01; *, p < 0.05; NS, not significant (ANOVA and Tukey's HSD post hoc test). F, cultured hippocampal neurons were co-transfected at DIV 16 with T157A-ARF6-HA or HA and pSIREN-empty (control (Ctrl) vector), shRNA-PAK1, or shRNA-ARF6 and fixed at DIV 20. The effect of ARF6-T157A with PAK1 depletion or ARF6 depletion on dendritic spine formation was quantified in mature neurons. The values in the spine number graph were recalculated to show percent differences between each group and HA. Detailed data are shown in Table 3. Data were collected for each group in three independent experiments. †††, p < 0.001; † and *, p < 0.05; NS, not significant (ANOVA and Tukey's HSD post hoc test). Error bars represent S.E.

