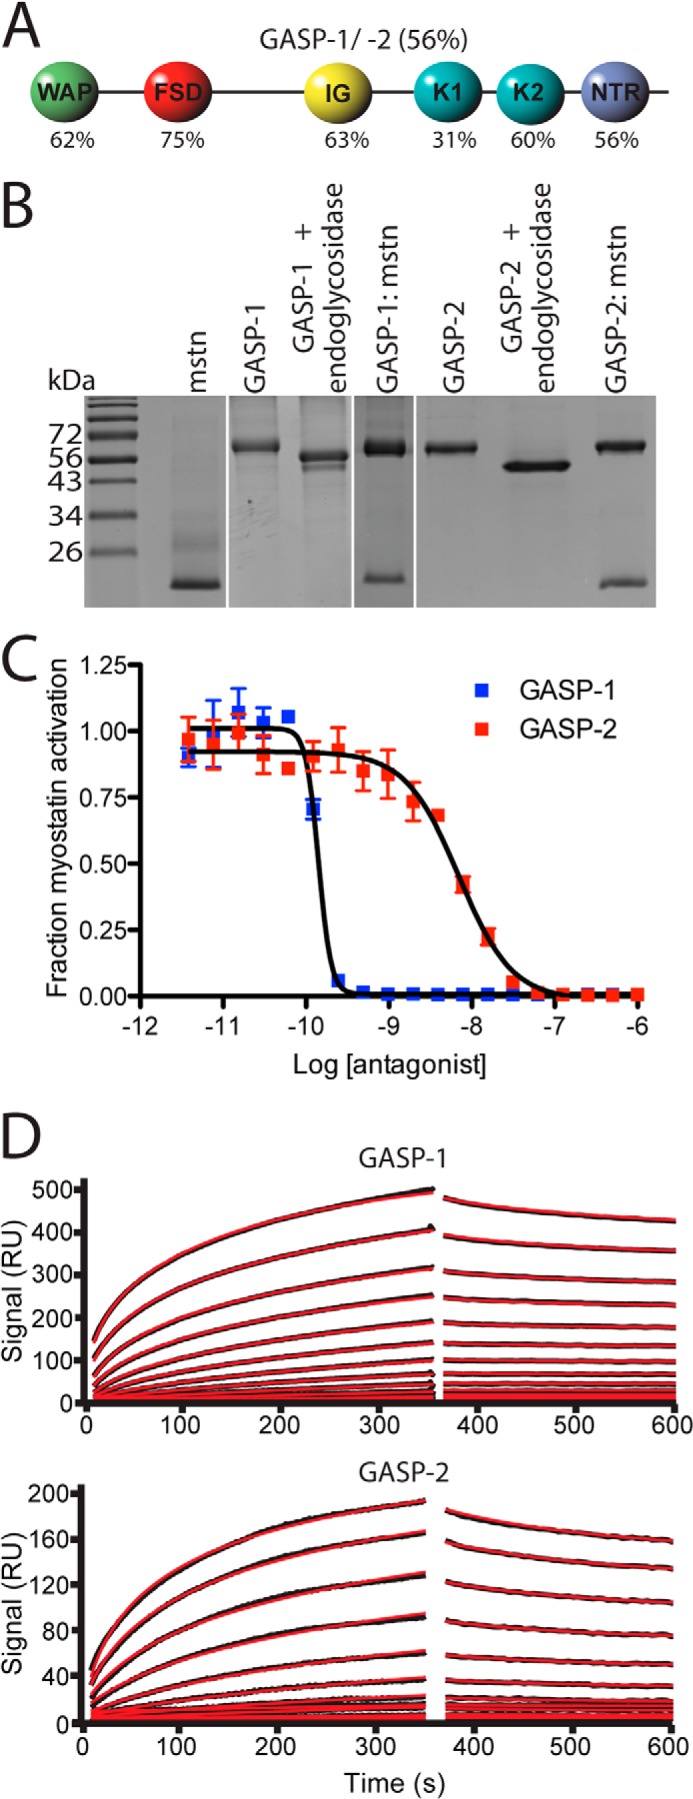
FIGURE 1.

Domain structure, purification, and biological activity of GASP-1 and GASP-2. A, schematic diagram of GASP-1 and GASP-2. The percentages listed are representative of sequence identity between GASP-1 and GASP-2. B, nonreduced SDS-PAGE gel of purified myostatin (mstn), GASP-1, GASP-2, and respective complexes between myostatin and GASP proteins. Note the shift in molecular weight of both GASP-1 and GASP-2 following treatment with endoglcyosidases. C, luciferase reporter assay showing the inhibitory activity of GASP-1 and GASP-2 tested against a constant concentration of myostatin using HEK293 (CAGA)12 cells (error bars represent ± standard deviation). The curves shown are representative of three independent assays. D, surface plasmon resonance sensorgrams for GASP-1 and GASP-2 binding to immobilized myostatin. GASP-1 binds to myostatin with an apparent Kd value of 28.5 pm, and GASP-2 binds to myostatin with an apparent Kd of 19 nm. The fitted line is shown in red.
