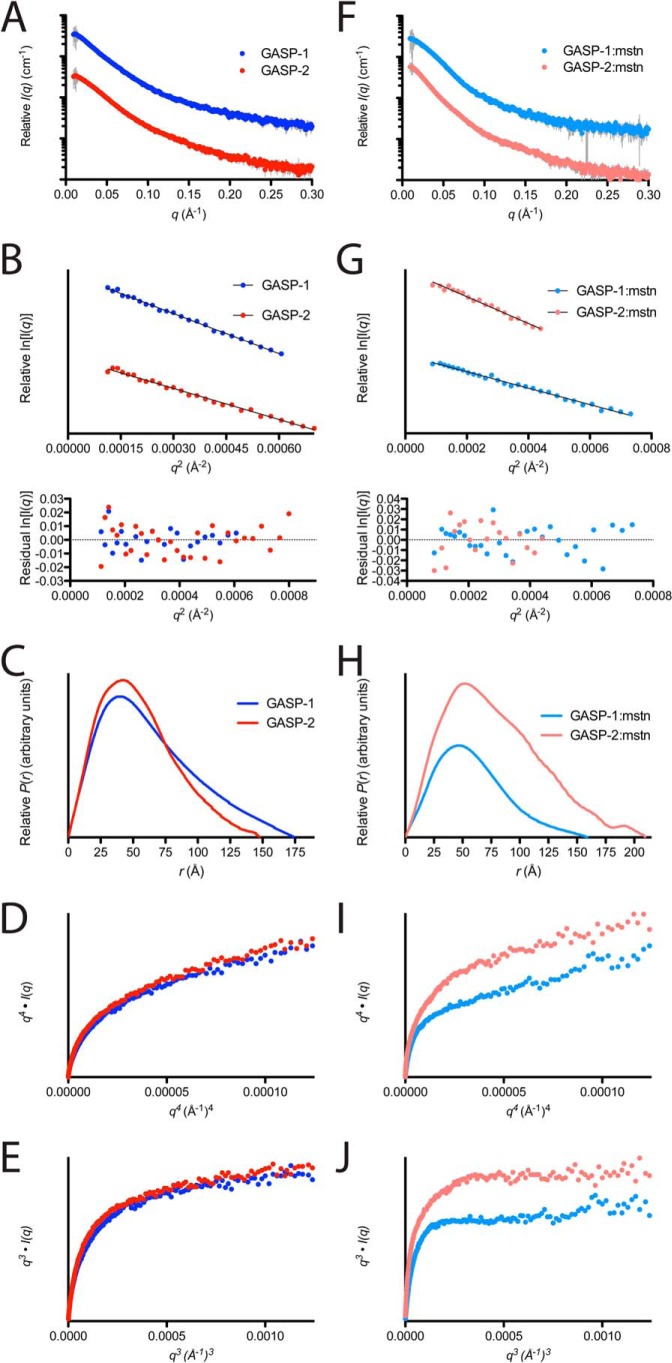
FIGURE 4.
SAXS analysis on GASP and GASP·myostatin complexes. A and F, intensity distribution of the SAXS scattering function for myostatin-free and myostatin-bound GASP proteins. B, Gunier plot for GASP-1 (dark blue) and GASP-2 (red) showing a linear, unbiased distribution. G, Gunier plot for GASP-1·myostatin (light blue) and GASP-2·myostatin (pink) showing a linear, unbiased distribution. Residuals are shown below each plot. C and H, pairwise distribution function for myostatin-free and myostatin-bound GASP proteins. D, q4·I(q) versus q4(Å−1)4 plot on GASP-1 (dark blue) and GASP-2 (red) showing a distinct increase in slope as q increases. D and I, q4·I(q) versus q4(Å−1)4 plot on GASP-1·myostatin (light blue) and GASP-2·myostatin (pink) showing a gradual increase in slope as q increases. E, q3·I(q) versus q3(Å−1)3 plot on GASP-1 (dark blue) and GASP-2 (red) showing a distinct plateau as q increases. J, q3·I(q) versus q3(Å−1)3 plot on GASP-1·myostatin (light blue) and GASP-2·myostatin (pink) showing a distinct plateau as q increases.

