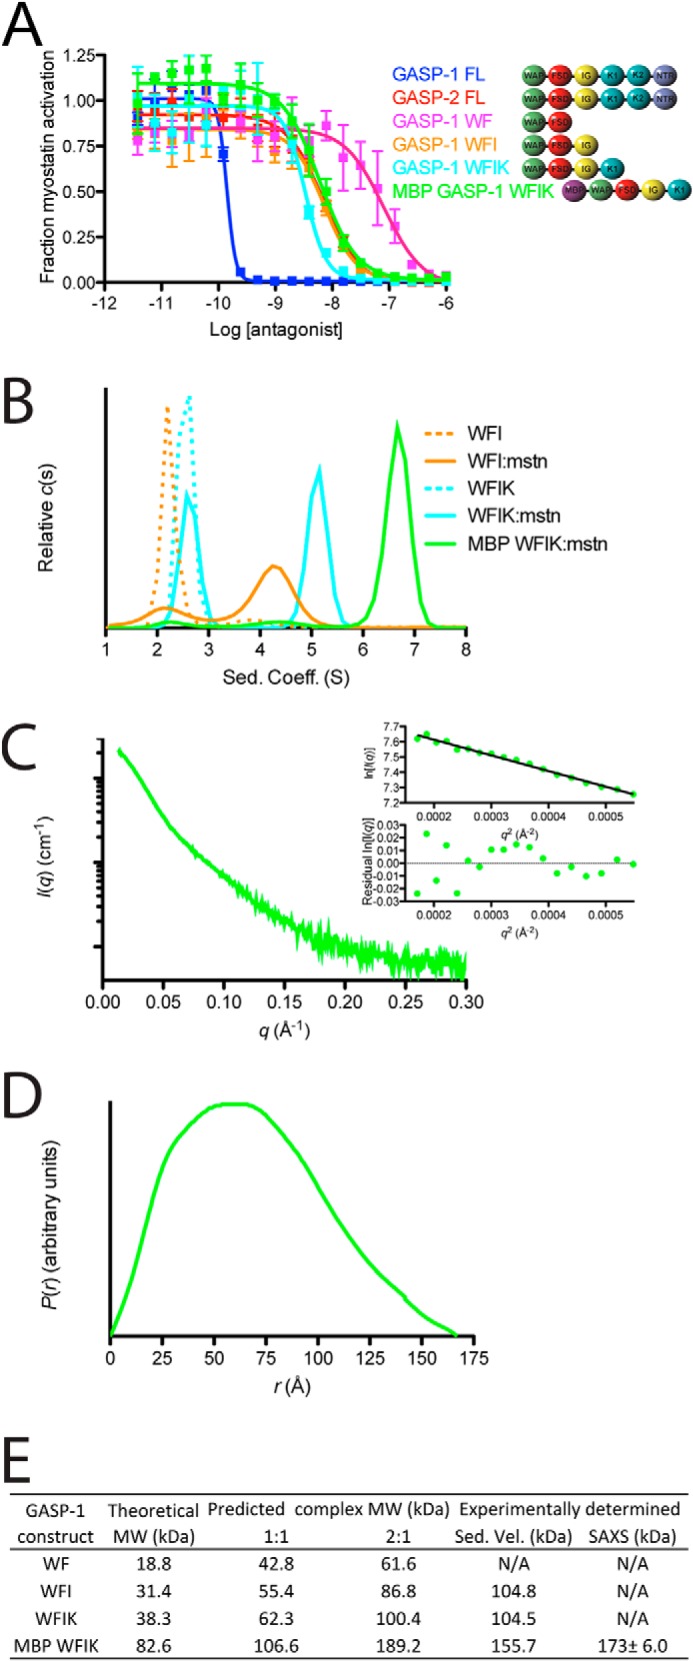
FIGURE 6.

Biological activity, sedimentation velocity analysis, and SAXS analysis of GASP-1 C-terminal truncations. A, luciferase reporter inhibition assay for GASP-1 C-terminal truncations tested against a constant concentration of myostatin using HEK293 (CAGA)12 cells (error bars represent ± standard deviation). A schematic representation depicting the domain architecture of each construct shown next to the curve labels. B, sedimentation velocity for the GASP-1 constructs WFI (dotted orange) and WFIK (dotted cyan), and complexes WFI·myostatin (solid orange), WFIK·myostatin (solid cyan), and MBP-WFIK·myostatin (solid green). C, SAXS scattering profile of the MBP-WFIK·myostatin complex. The Gunier plot and residuals shown in the inset demonstrate that the sample is free of aggregation. D, pairwise distribution function of the MBP-WFIK·myostatin complex. E, summary of the theoretical, expected, and experimentally determined molecular weights for GASP-1 C-terminal constructs in complex with myostatin.
