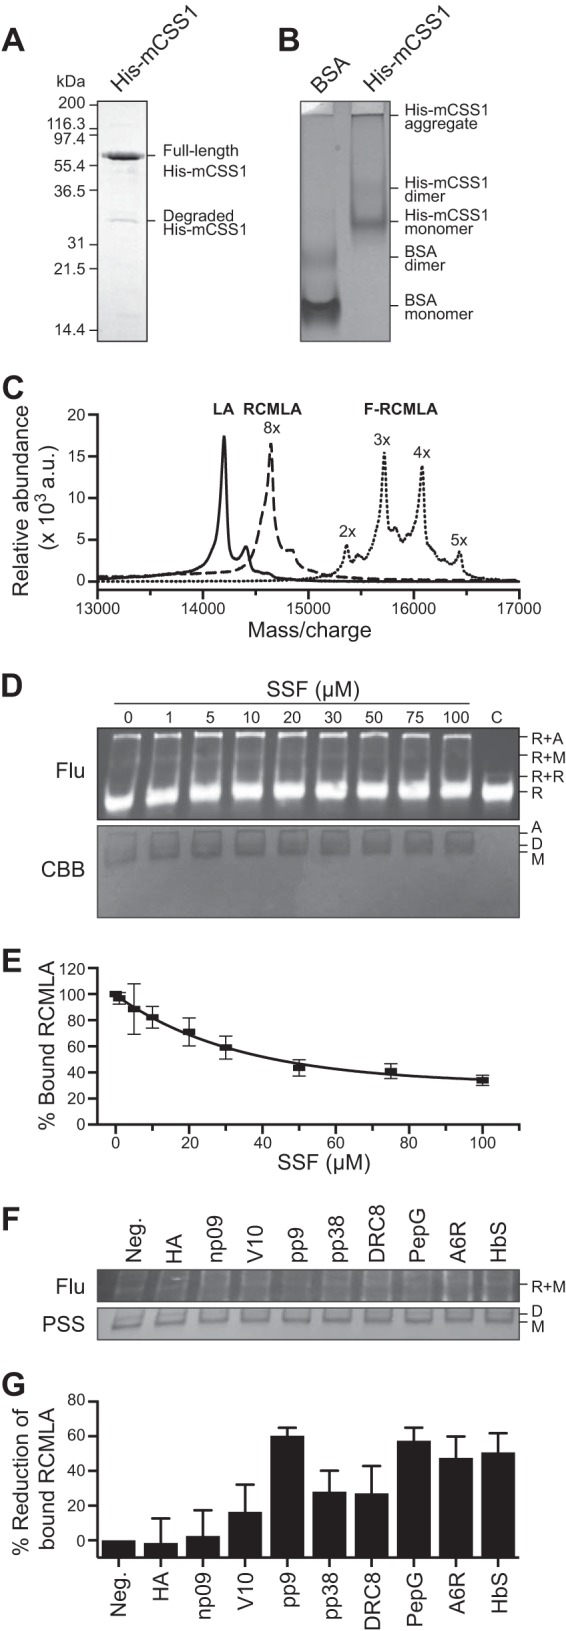
FIGURE 3.

Relative affinities of the N-ter peptides to the chloroplast Hsp70. A, SDS-PAGE of purified chloroplast Hsp70, His-mCSS1. B, native PAGE of His-mCSS1 with BSA as control. C, MALDI-TOF spectra of bovine α-lactalbumin, RCMLA, and F-RCMLA. D and E, competitive binding assay of SSF against F-RCMLA binding to His-mCSS1. The assay concentration of SSF is indicated. The control lane (C) lacked His-mCSS1. D, representative of a nitrocellulose membrane of the native PAGE of the binding reactions at different concentrations of SSF. Top and bottom panels show the fluorescent signals of F-RCMLA (Flu) and the Coomassie Brilliant Blue (CBB)-stained His-mCSS1. R, F-RMCLA; A, aggregated His-mCSS1; D, His-mCSS1 dimer; M, His-mCSS1 monomer. E, quantification of the F-RCMLA-His-mCSS1 (R+M) complex from the fluorescent signals. n = 3. Means ± S.E. are shown. F and G, competitive binding assay of the N-ter peptides against F-RCMLA binding to His-mCSS1. The assays contain 40 μm of the N-ter peptide. F, representative of a nitrocellulose membrane of the native PAGE of the binding reactions. Top and bottom panels show the fluorescent signals of F-RCMLA (Flu) and the Ponceau S-stained His-mCSS1 (PSS). R, F-RMCLA; D, His-mCSS1 dimer; M, His-mCSS1 monomer. G, quantification of the F-RCMLA-His-mCSS1 (R+M) complex from the fluorescent signals. The negative control lane (Neg.) lacked the N-ter peptide. The fluorescent signal of R+M in the negative control lane was defined as 100% bound RCMLA. n = 6. Means ± S.E. are shown.
