
FIGURE 8.
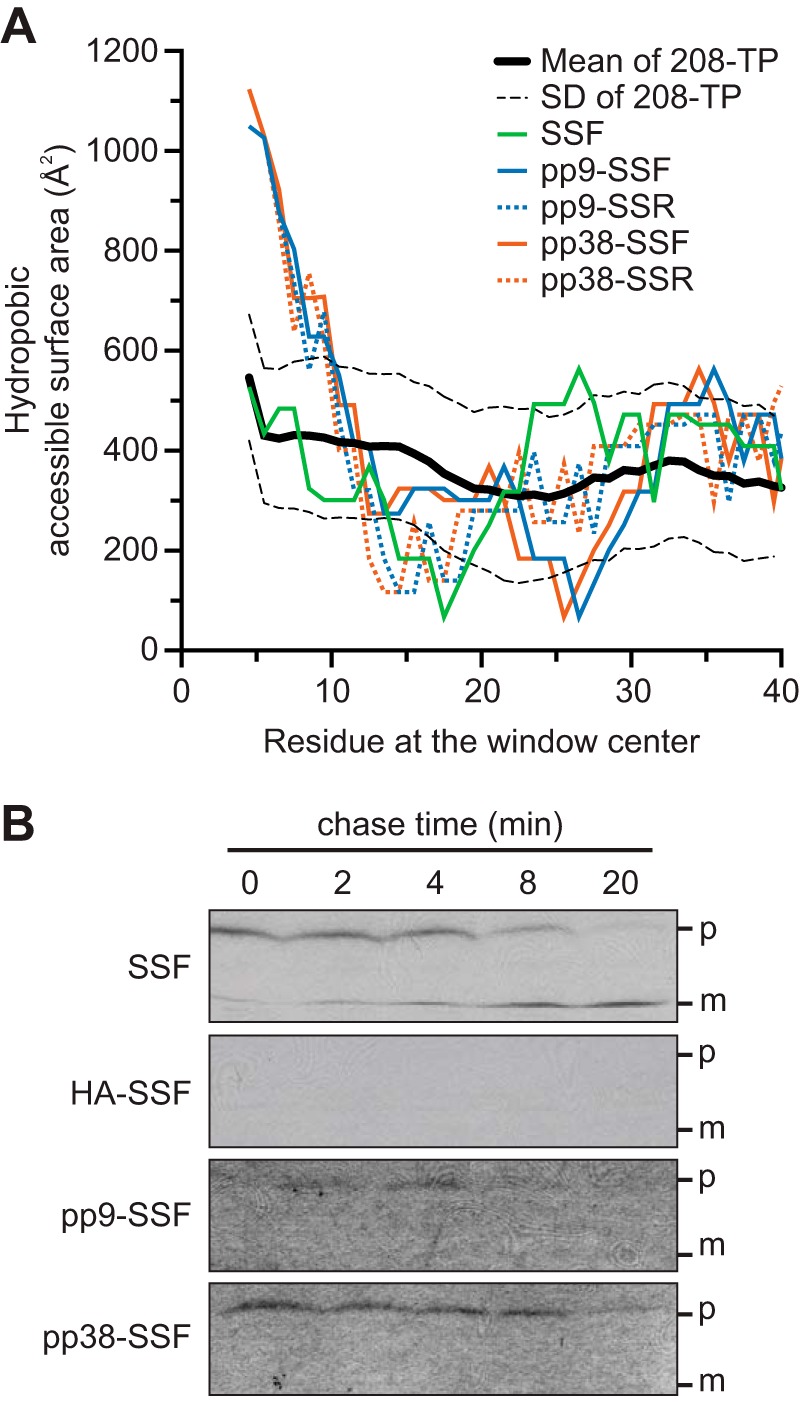
Hydrophobic accessible surface area of the mutant N-ter and the pulse-chase assays. A, HASA within an 8-aa window are plotted along the length of the aa sequences. The average HASA calculated from the 208-TP dataset is shown as a reference (black line) with S.D. as dashed lines. B, pulse-chase assays of the precursors of SSF, HA-SSF, pp9-SSF, and pp38-SSF fusion to mSSU followed by 3×HA and His6 tags. p, full-length precursors; m, imported and processed mature domains.