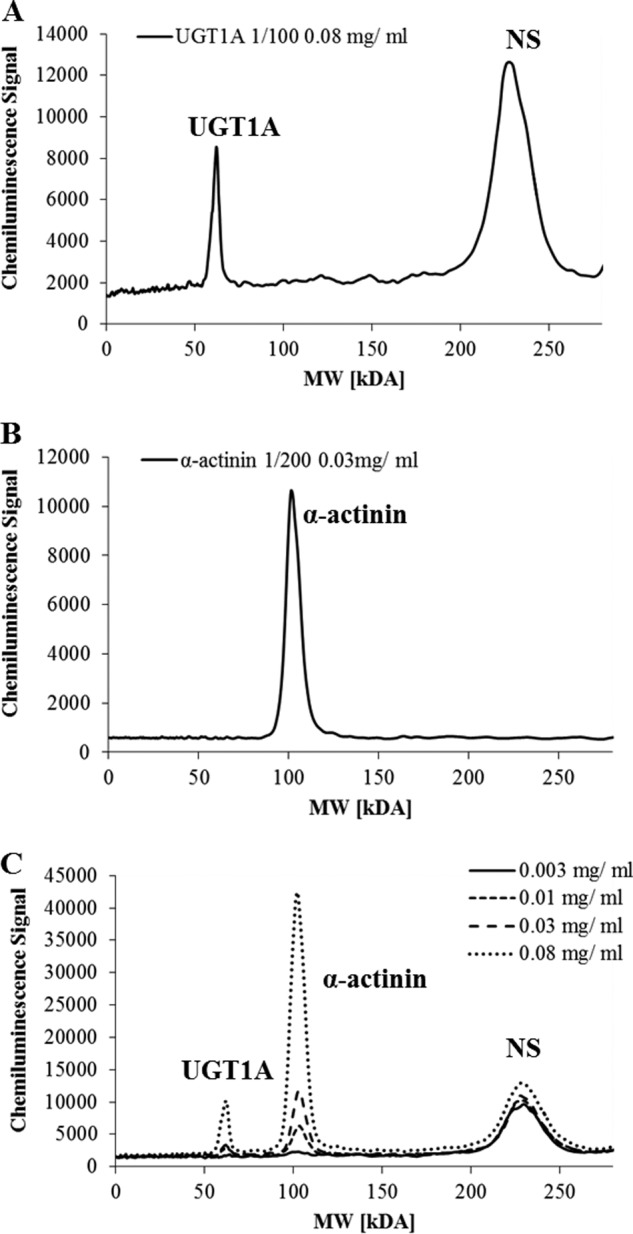
FIGURE 6.

Specificity of antibodies used for UGT1A detection (A) and α-actinin (B) is shown. C, pherogram view of different amounts of whole cell lysate analyzed for standard curve construction. NS denotes nonspecific interactions of the UGT1A antibody with the fluorescence standards used in the ProteinSimple WES system. Antibody dilution and total protein concentration are indicated.
