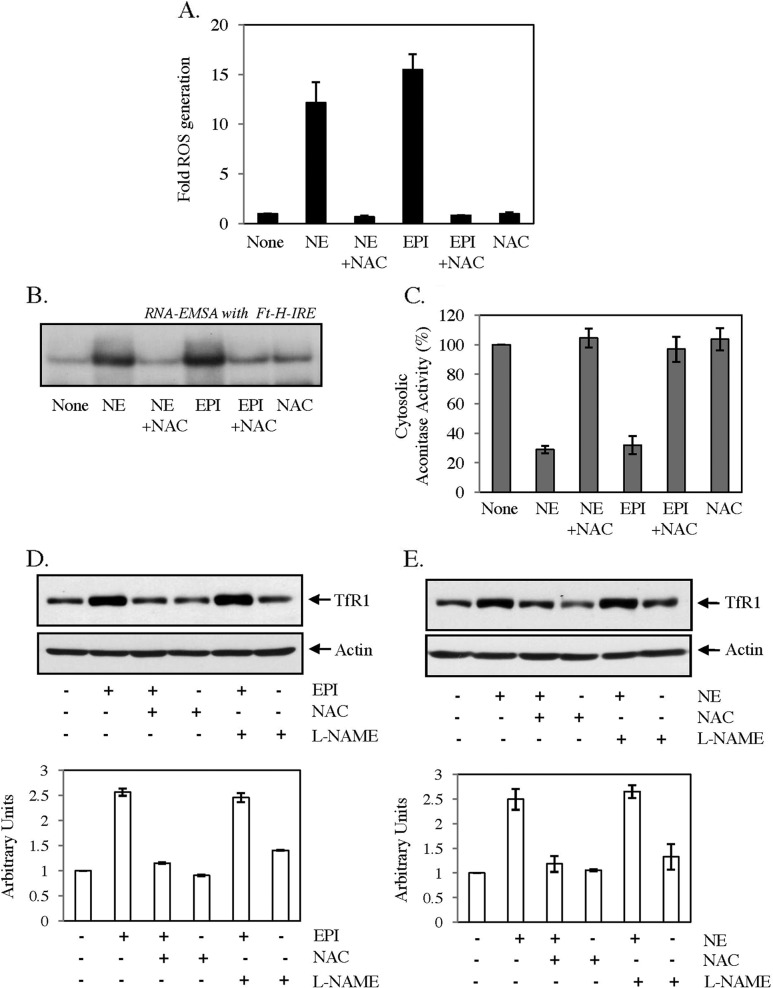
FIGURE 6.
Role of ROS in catecholamine-induced IRE-IRP interaction and TfR1 expression. A, HepG2 cells were treated with medium alone (None), EPI (30 μm), or NE (30 μm) for 30 min, and intracellular ROS generation was detected by fluorescence microscopy using DCFH-DA as a substrate. NAC (7.5 mm) was added 30 min prior to the addition of EPI or NE. B, HepG2 cells were treated with 30 μm EPI or NE for 10 h or kept untreated (None). NAC (7.5 mm) was added 30 min prior to EPI/NE treatment. RNA gel-shift analysis was performed using cytosolic extracts and radiolabeled Ft-IRE probe. Data represent one of the three independent experiments. C, aconitase assay was performed in cytosolic extracts of medium alone (None) or EPI/NE (30 μm)-treated cells. NAC (7.5 mm) was added 30 min prior to catecholamine treatment. D and E, TfR1 (upper panels) and actin (lower panels) expressions in HepG2 cell lysates treated with either 30 μm EPI (D) or 30 μm NE (E) were analyzed by Western blot analysis. In both cases, cells were pretreated with NAC (7.5 mm) or l-NG-nitroarginine methyl ester (l-NAME) (1 mm) for 30 min before the catecholamine treatment. TfR1 expression was quantified after normalization with actin (histograms below). Error bars indicate S.D. from three independent experiments.

