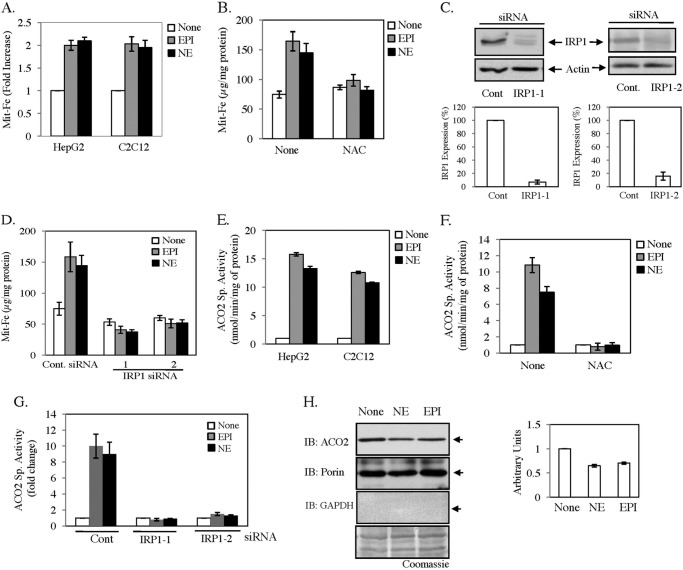
FIGURE 7.
Catecholamines increase mitochondrial iron content mediated by IRP. A, HepG2 and C2C12 cells were treated with 30 μm EPI, NE, or medium alone (None). After 16 h, mitochondria were isolated, and total iron was estimated using a standard. B, similarly, mitochondrial iron was estimated in HepG2 cells with prior treatment of 7.5 mm NAC for 30 min. C, HepG2 cells were transfected with control (Cont)- or IRP1-specific siRNAs (IRP1-1 and IRP1-2). After recovery, Western blot analysis was performed with either IRP1 or actin antibody. Densitometric analyses of these blots were shown in the bottom panels. Error bars indicate S.D. from three independent experiments. D, estimation of mitochondrial iron was performed in control- and IRP1 siRNA-transfected cells after treatment with 30 μm EPI/NE or medium alone (None) for 16 h. E, ACO2 specific activity (ACO2 Sp. Activity) was assayed in mitochondrial extracts isolated from HepG2 and C2C12 cells after treatment with 30 μm EPI/NE or medium alone (None) for 16 h. F, C2C12 cells were pretreated with 7.5 mm NAC for 30 min and then exposed to 30 μm EPI/NE or medium alone (None). After 16 h, an aconitase assay was performed on mitochondrial extracts. G, HepG2 cells were transfected with control- or IRP1-specific siRNAs, and an ACO2 activity assay was performed in mitochondrial extracts isolated from transfected cells after treatment with 30 μm EPI/NE or medium alone (None) for 16 h. H, Western blot analyses were performed in mitochondrial extracts with ACO2, porin, and GAPDH antibody after a 16-h treatment of medium alone (None) or EPI/NE (30 μm). The bottom panel shows the Coomassie Brilliant Blue-stained PVDF membrane after the blot (IB) was performed for GAPDH. The side panel represents densitometric analysis of ACO2 expression with porin as loading control from three independent experiments.

