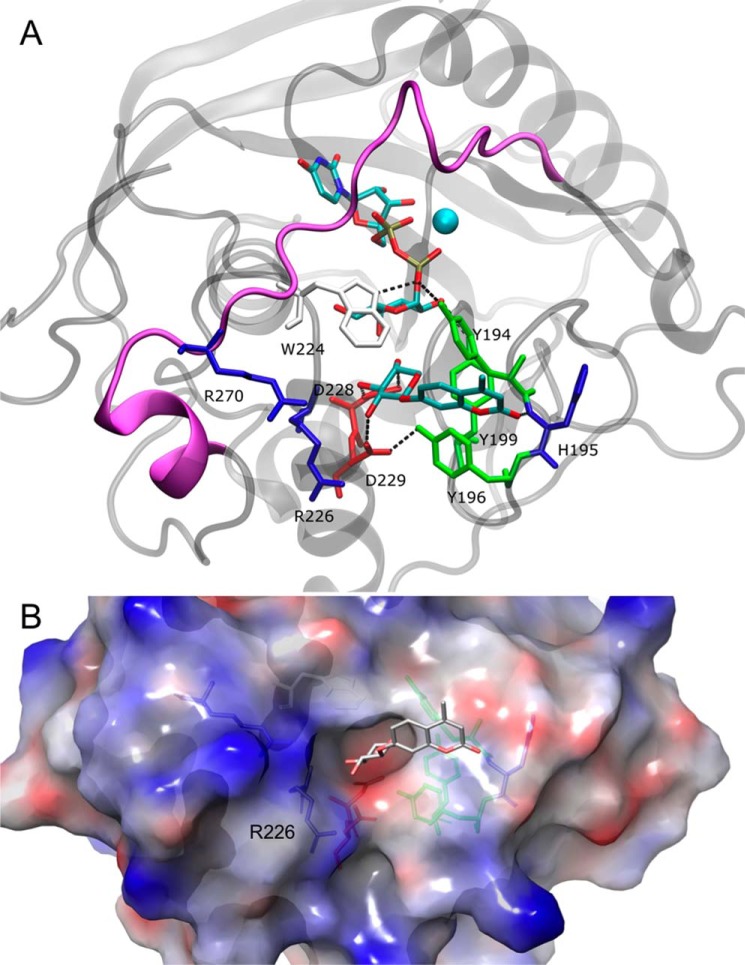
FIGURE 1.
Molecular modeling of the hβ4GalT7 structure. A, view of the active site of hβ4GalT7 in complex with donor (UDP-Gal) and acceptor (4-MUX) substrates. The protein α-carbon trace is represented as gray ribbons; the purple ribbon corresponds to the protein backbone that is not seen in the open conformation. B, surface representation of the acceptor binding site, in the same orientation as in A. The electrostatic potential is mapped onto the protein surface and is colored from red (negative) to blue (positive).

