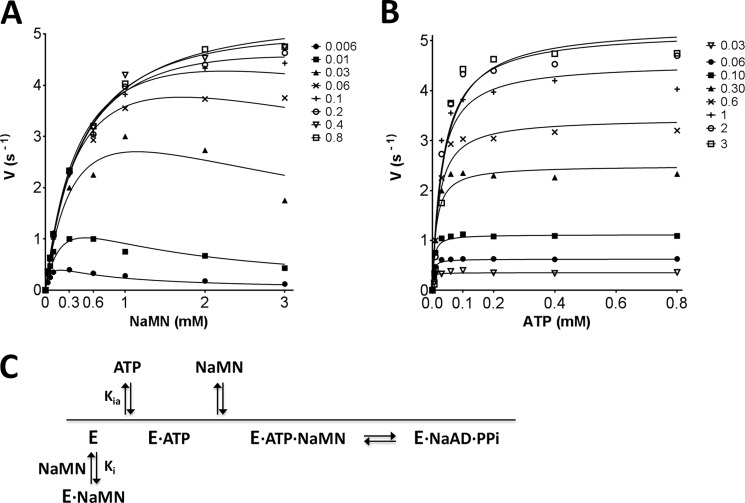
FIGURE 6.
Steady-state kinetic analysis of MtNadD. Initial rate plots as a function of NaMN substrate concentration (mm) measured at varied fixed concentration of ATP substrate (A) and vice versa (B). Details of the assay setup are provided “Experimental Procedures.” Of note, due to the dynamic range of the enzymatic assay, it was not possible to provide initial rate values at an ATP concentration below its calculated Km. Thus, Km for ATP is an approximate value. C, simplified reaction course diagram. The binding of NaMN in the absence of ATP-induced enzyme activation generates a nonproductive E·NaMN complex.

