FIGURE 8.
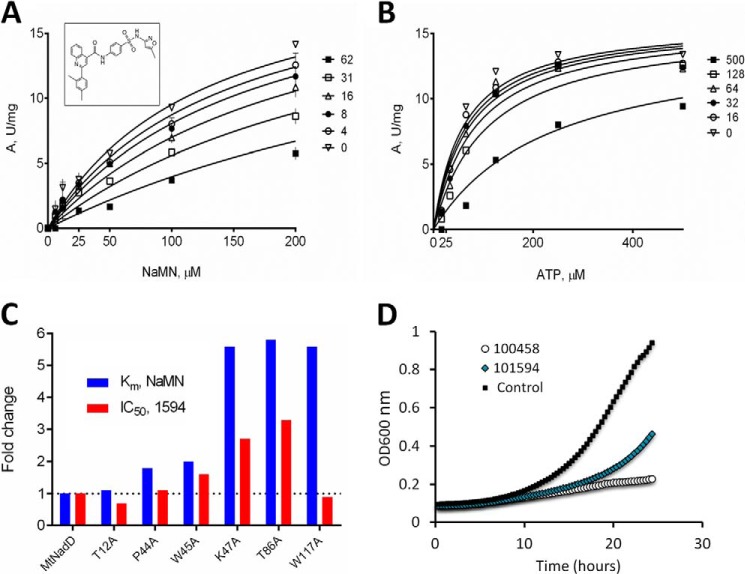
Inhibitory profiling of compound 1549 (shown in the inset). Competitive inhibitory mechanism with respect to the NaMN substrate (apparent Ki = 25 μm) at a fixed concentration of ATP 300 μm. Inhibitor concentration ranged from 0 to 62 μm (A). Inhibition of MtNadD by compound 1594 at varying ATP concentrations is shown. Appreciable inhibition could be detected only above 100 μm inhibitor concentration (B). Effect of 1594 inhibitor on selected MtNadD mutants (C) is shown. The apparent values of Km for the NaMN substrate (blue bars) and the IC50 (at half-saturating concentration of NaMN for each mutant) for compound 1594 are presented as -fold change compared with the respective wild type values (absolute values are provided in Table 2). Two of the three mutants with the largest increase in Km for NaMN (∼5.5-fold) also show the largest increase in the observed IC50 for compound 1594 (∼3-fold). D, M. smegmatis growth inhibition at 20 μm by compounds 1594 and 0458.

