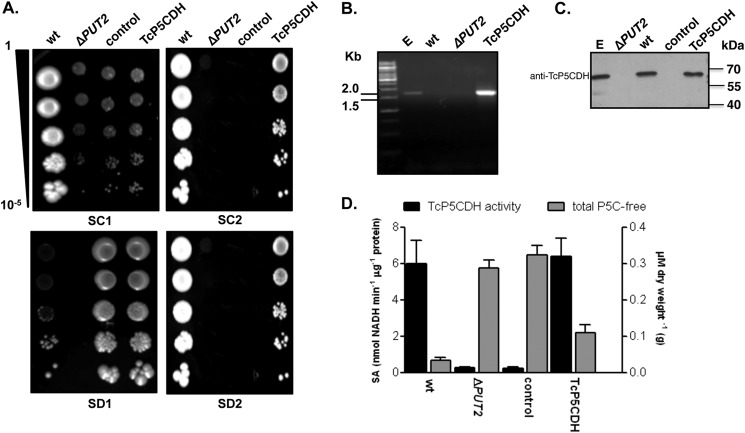
FIGURE 2.
Yeast functional complementation assay. PUT2 activity-deficient mutant strain was transformed by the episomal insertion of the TcP5CDH gene. A, drop tests in selective media. For phenotypic analysis, yeast cells were grown in liquid medium (until A600 nm = 1) and then serially diluted (1–10−5) in sterile water prior to spotting. Synthetic complete plates (SC) contained a dropout mix with all amino acids, including uracil, ammonium sulfate, and galactose as nitrogen and carbon sources (SC1). SC without uracil or ammonium sulfate but with proline and G418 added are referred to as SC2. Synthetic depleted plates (SD) contained only methionine, ammonium sulfate, and galactose (SD1) or methionine, proline, and galactose (SD2). Final concentrations are described under “Experimental Procedures.” Cells were incubated at 28 °C for 2 or 4 days for the SC and SD tests, respectively. B, transcriptional levels of TcP5CDH were assayed by RT-PCR with specific primers. Amplified products were resolved in 1% agarose gel (w/v) and stained with 0.5 μg·ml−1 ethidium bromide. Gel samples were loaded as follows: 1st lane, 1-kb DNA ladder (Fermentas®); 2nd lane, products amplified using either total genomic DNA from epimastigote forms; 3rd lane, total cDNA from wild-type yeast; 4th lane, cDNA from the ΔPUT2 mutant; or 5th lane, cDNA from the TcP5CDH mutant as templates in PCR. C, Western blot analysis with protein extracts was performed as indicated. Membranes were probed against anti-TcP5CDH produced in mice (1:2000) and developed as described elsewhere. D, biochemical analysis of yeast cells. Cell-free extracts (100 μg) from 500 ml of yeast cells, grown in either SC1 or SC2 media, were used as an enzyme source in enzymatic determinations (left axis) or reacted with OAB for the quantification of free P5C levels. Intracellular P5C levels are expressed as the concentration (μm) ratio with respect to the biomass of dried yeast cells (grams) (right axis). The data are representative of three independent measurements.

