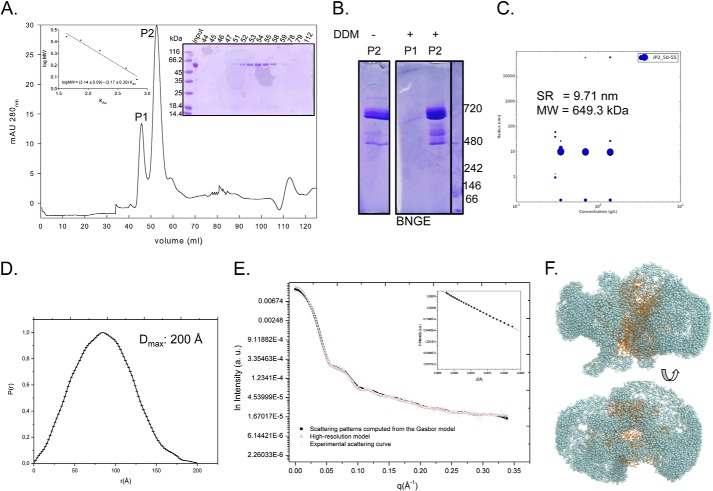
FIGURE 3.
Analysis of purified TcP5CDH-His6 in solution. A, recombinant TcP5CDH-His6 was produced in E. coli and purified by affinity chromatography and SEC. After SEC separation, two major peaks (λ280 nm) were observed (P1 and P2), and the protein sample was subjected to electrophoresis in a 10% SDS-polyacrylamide gel stained with Coomassie Blue (right inset). Size determinations were determined from calibration curve used in SEC separation (left inset). B, BNGE of the pooled fractions from SEC. Fractions 44–47 (corresponding to P1) and 51–54 (corresponding to P2) were pooled, concentrated, and resuspended at 0.5 μg/μl in P5CDH buffer in the presence or absence of 0.02% DDM. Molecular mass determinations were determined by comparing the samples migration against protein standards. C, DLS of P2 was performed at three different concentrations. Fractions 51–54 (corresponding to P2) were pooled, concentrated, and resuspended at 0.3, 0.75, and 1.5 μg/μl in P5CDH buffer in the presence of 0.02% DDM. Hydrodynamic radius (RH) and molecular mass (MW) were similar for the tested concentrations. D, distance distribution function of TcP5CDH from the experimental x-ray scattering data. The determined value of maximum distance (Dmax) is indicated. E, experimental solution scattering curves of TcP5CDH-His6 (log I versus q) and the results of the fitting procedures. Fraction P2 was resuspended in buffer containing 90 mm HEPES-NaOH, pH 7.2, and 5% glycerol (v/v) and was concentrated up to 2.5 mg ml−1. Scattering curves obtained from experimental data for TcP5CDH from the high resolution model (Protein Data Bank code 1UZB) and scattering patterns computed from the Gasbor model were plotted as indicated. The inset displays the correspondent Guinier plot (log I versus q2). F, low resolution structure of the TcP5CDH in solution as obtained by Gasbor (spheres) with superposition of the high resolution model (1UZB) (ribbons). The models were rotated 90° with respect to the y axis. a.u., absorbance units.

