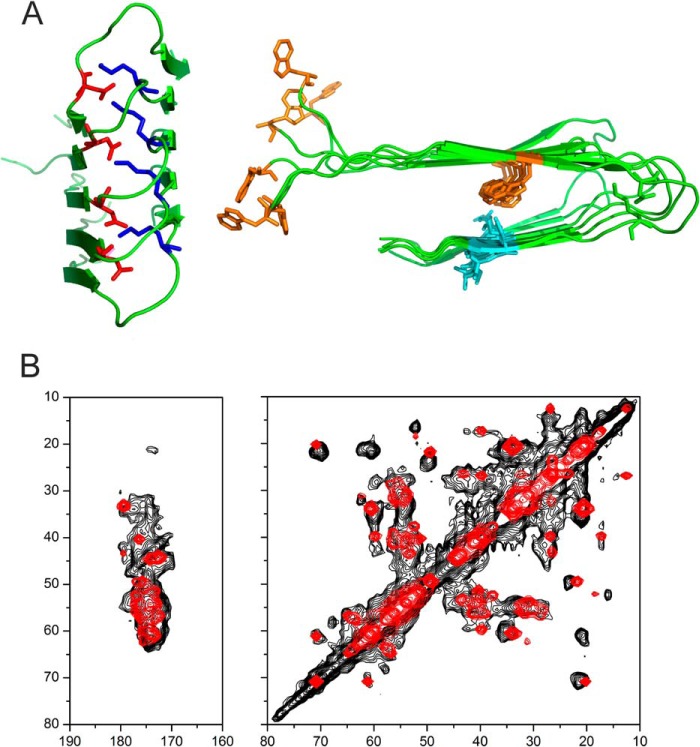
FIGURE 10.
Homology modeling of fibrillar medin. A, model of medin fibrils created in Modeler using the Aβ(1–40) structural model (Protein Data Bank entry 2LMN) as a template and the sequence alignment in Fig. 1B. No further refinement of the model was performed. The left view (perpendicular to the fibril axis) shows the turn region stabilized by the salt bridge between Asp25 (red) and Lys30 (blue). The right view (down the fibril axis) shows Trp11 and Trp21 (orange) and Ile35 and Ile36 (cyan), with close packing of Trp21 and Ile35. B, simulated DARR spectrum (red) calculated from 13C chemical shifts predicted from the structural model using SHIFTX2, superimposed on the experimental spectrum (black).

