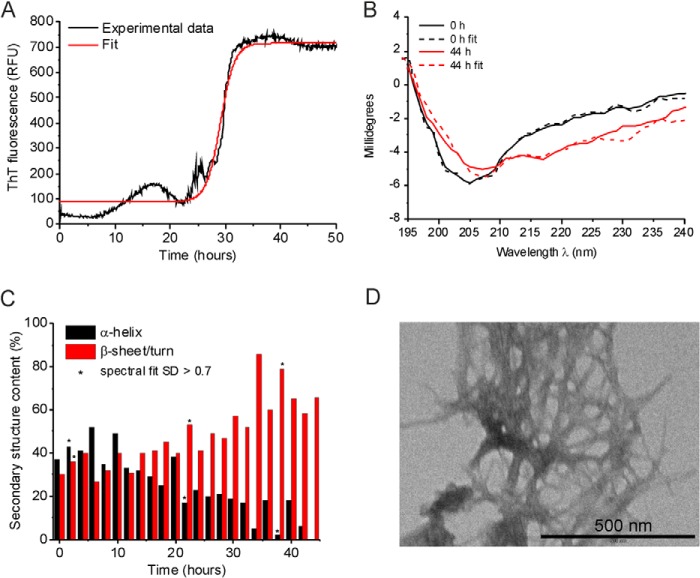
FIGURE 2.
Biophysical characterization of WT medin aggregation. A, ThT fluorescence of medin aggregation. The mean fluorescence time course for three samples is shown. B, CD spectra of a medin solution obtained immediately after preparation (black) and after 44 h (red). Dotted lines represent the best fitting simulated spectra from which the secondary structure content was estimated. C, secondary structure changes during medin aggregation estimated from the CD spectra. Asterisks signify spectra for which the fitting process used to calculate secondary structure content resulted in S.D. of >0.07. D, TEM images of medin aggregates at 50 h. RFU, relative fluorescence units.

