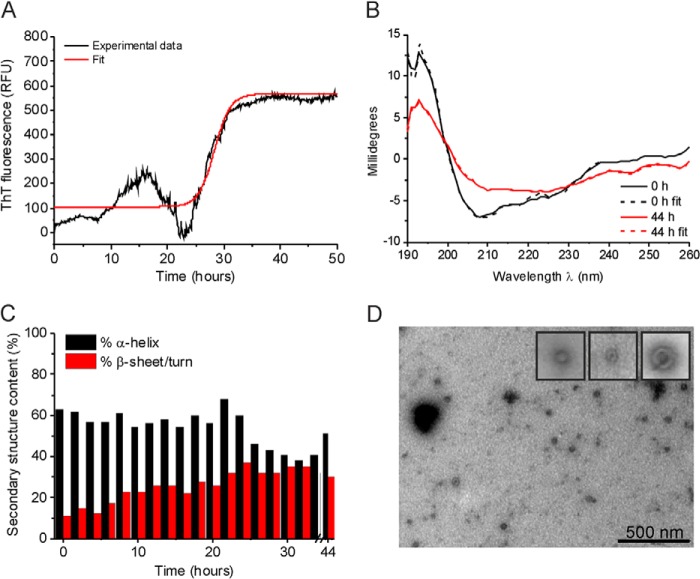
FIGURE 3.
Biophysical characterization of medin D25N aggregation. A, ThT fluorescence of medin aggregation. B, CD spectra at the initial (black) and 44 h (red) time points with the best fitting simulated spectra (dashed lines). C, secondary structure changes during D25N aggregation estimated from the CD spectra. D, TEM images of medin aggregates at 50 h. RFU, relative fluorescence units.

