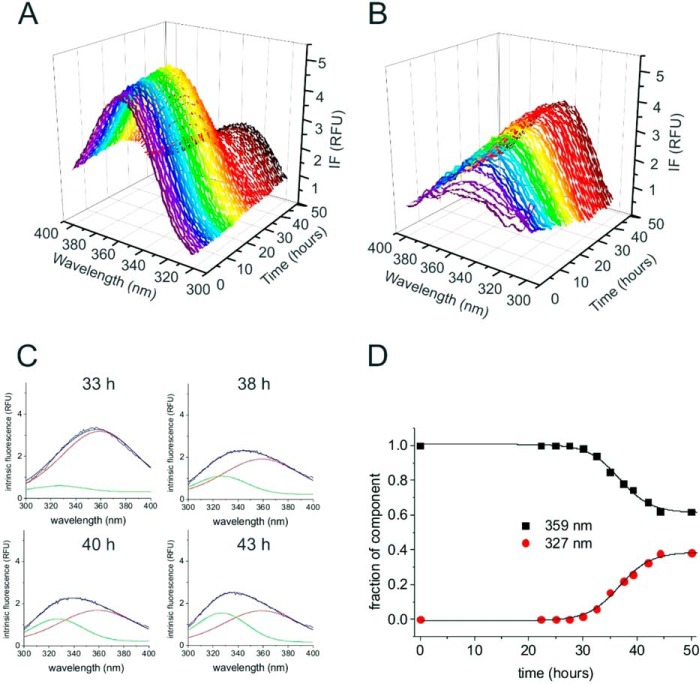
FIGURE 5.
Intrinsic fluorescence of medin tryptophan residues Trp11 and Trp21. A, time course of fluorescence emission during WT medin aggregation. B, time course of fluorescence emission during D25N aggregation. C, deconvolution of the spectra for WT medin. Examples of spectra at the time points given (black lines) are superimposed with non-linear least squares fitted spectra (blue lines) approximated by two Gaussian components centered at 359 nm with a 60-nm width at half-height (red line) and at 327 nm with a 40-nm width (green line). The areas under the two components were the only variables. No further changes in the spectra were observed after 43 h. D, time course of the deconvoluted intrinsic fluorescence spectra of WT medin. The fractions of the two spectral components centered at 359 and 327 nm were calculated from the areas of the Gaussian curve fits. RFU, relative fluorescence units.

