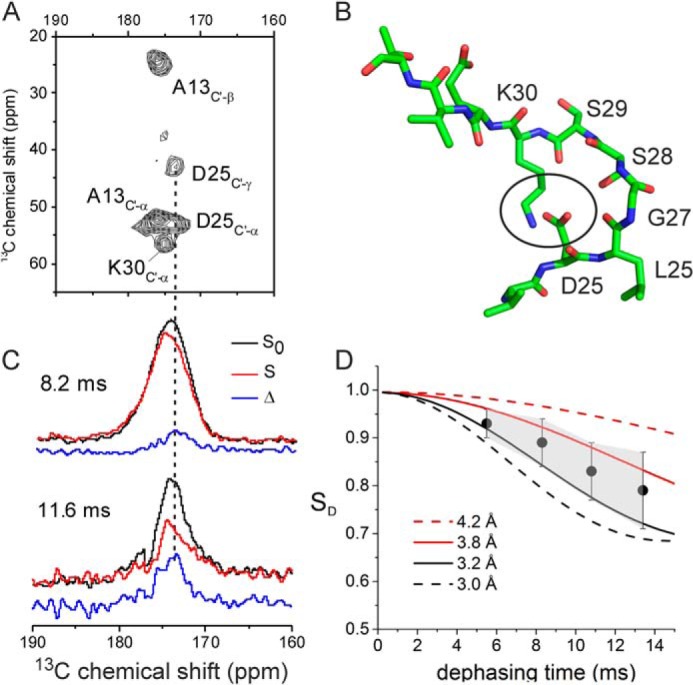
FIGURE 6.

Evidence for a salt bridge between Asp25 and Lys30 in medin fibrils. A, amide region of a 13C DARR NMR spectrum of selectively labeled medin fibrils. B, a model of a medin monomer with an intermolecular salt bridge between the Asp25 and Lys30 side groups (circled) constraining the backbone in a turn. C, detection of 13C-15N dipolar coupling by FSR NMR analysis of the fibrils at 8.2 and 11.6 ms dephasing times. Black, control full-echo spectrum. Red, dephased echo spectrum obtained with a π pulse train at the frequency of Nζ for Lys30. Blue, difference spectrum (Δ). D, plot of observed FSR dephasing (circles) with simulated curves for different 13C-15N distances as stated. The error bars and shaded region represent the level of the noise. Error bars, S.D.
