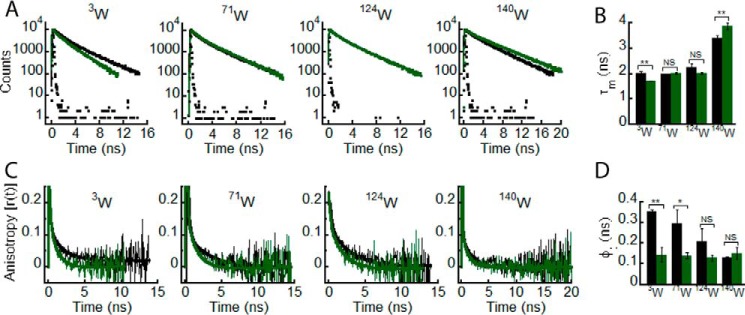
FIGURE 2.

Effect of denaturation on the site-specific structure of α-Syn. The freshly prepared low molecular weight solutions of Trp3, Trp71, Trp124, and Trp140 α-Syns were denatured by adding 6 m GdnHCl and subjected to time-resolved fluorescence studies. Black and green represent the low molecular weight state and denatured state, respectively, of each Trp mutant of α-Syn. A, time-resolved fluorescence intensity decay kinetics fitted to a three-exponential function (smooth lines) showing a change in decay kinetics of Trp3, Trp71, Trp124, and Trp140 upon denaturation. B, mean fluorescence lifetime (τm = Σαiτi) values calculated by fitting the fluorescence intensity decays and represented as a bar diagram (mean ± S.D., n = 3) indicating a change in microenvironment experienced by Trp3 and Trp140 upon denaturation. C, time-resolved fluorescence anisotropy decay kinetics fitted to a two-exponential function (smooth lines) showing a faster decay of fluorescence anisotropy of Trp3 and Trp71 upon denaturation. D, rotational correlation times associated with the local motion of Trp (φ1) calculated by fitting the fluorescence anisotropy decays and represented as a bar diagram (mean ± S.D., n = 2) indicating an increase in conformational flexibility of Trp3 and Trp71 upon denaturation. The statistical significance is as follows: *, p < 0.05; **, p < 0.01; NS, not significant, p > 0.05. Error bars represent S.D.
