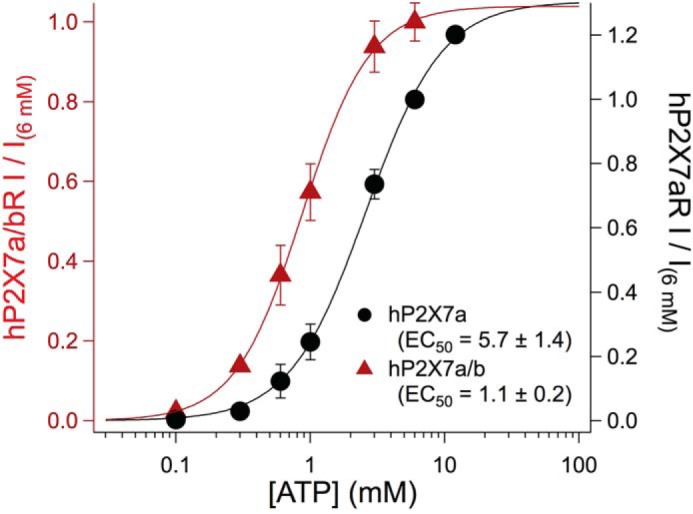
FIGURE 4.

Concentration-current curves for homomeric and heteromeric human P2X7Rs. Concentration-response curves were built from HEK293 transfected either with the hP2X7aR plasmid alone (black), or co-transfected with the hP2X7aR and hP2X7bR plasmids (red). Each data point was normalized to the peak current caused by applying 6 mm ATP to the same cell. Individual data points corresponding to specific concentrations of ATP were averaged (solid circles). The solid lines show the best fit of the averaged data to the Hill equation. For statistical analysis, EC50 values were calculated from data of complete concentration-response curves obtained from 12 individual cells. Significance was determined using Student's t test.
