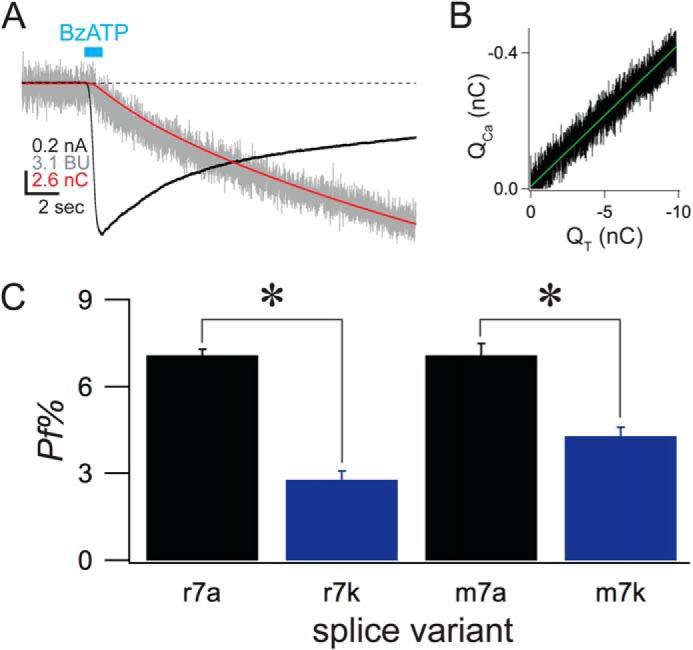
FIGURE 6.

The rP2X7kR carries a small Ca2+ current. A, the traces show raw data of an experiment that measured the Pf% of a cell expressing the rP2X7kR. The cell was held at −60 mV under voltage-clamp. BzATP (100 μm) was applied for the time indicated by the cyan bar. The black trace is the membrane current measured in nAs. The red trace is the integrated membrane current and equals QT. The gray trace is the normalized fura-2 fluorescence, measured in bead units and proportional to QCa (see “Experimental Procedures” for full details). B, the graph shows a linear relationship between QT (x axis) and fluorescence (y axis), a strict requirement of the dye-overload method (64). C, the histogram shows the average data of mouse and rat splice variants.
