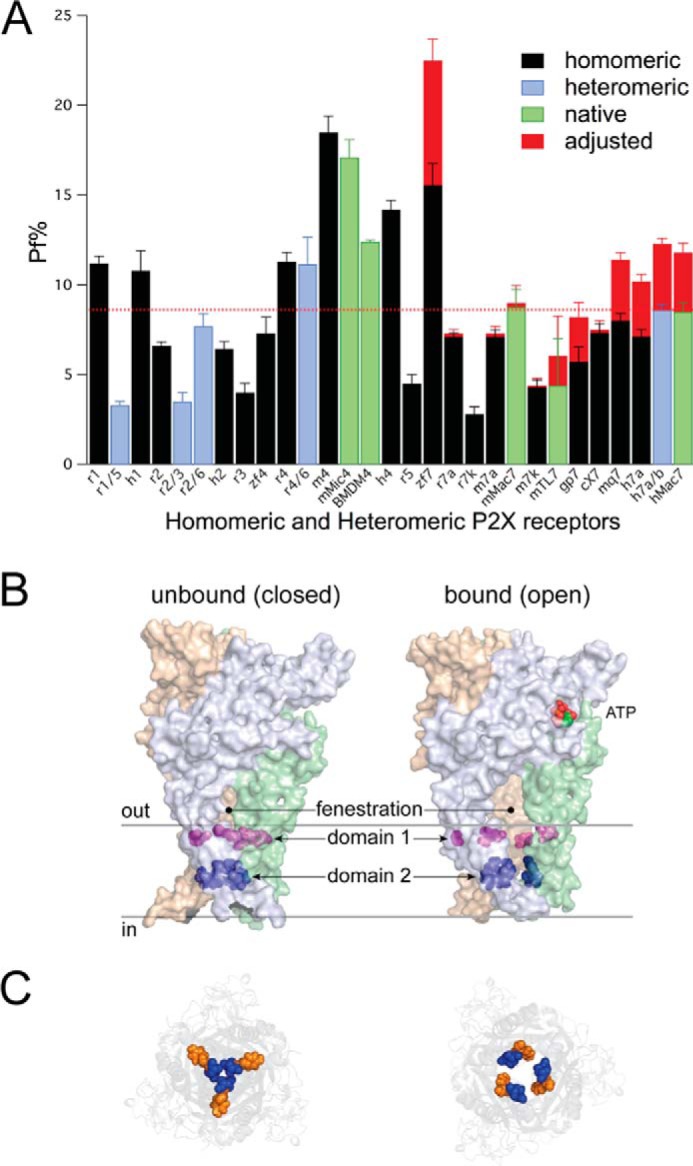
FIGURE 8.

Fractional Ca2+ current of homo- and heteromeric P2X receptors. A, the graph shows the average Pf% for all homomeric (black), heteromeric (blue), and native (green) P2X receptors measured to date. Data of native and recombinant P2X7Rs come from the present study. Measures of the Pf% of recombinant P2X1R-P2X6Rs come from our published data (1, 83, 100) with one exception; data of recombinant hP2X2aR are previously unpublished observations. Data of the native P2X4R of mouse bone marrow-derived macrophages (BMDM4) are unpublished observations of Samways and Egan obtained during a previous study (27). The red bars indicate the average adjusted Pf% of the P2X7Rs expected in the absence of Ca2+ chelation by BzATP. The red line indicates the average Pf% of all P2XRs. P2X7R data come from the present study. c, gp, h, m, mq, r, and zf are canine, guinea pig, human, mouse, macaque, rat, and zebrafish data, respectively. mMic4 are native currents of mouse microglia. hMac7 and mMac7 are native currents of human and mouse macrophages, respectively. mTL7 are native currents of mouse CD4+Foxp3+ regulatory T lymphocytes. B, homology model of the closed and open truncated rat P2X7aR in the closed and open states viewed from the plane of the membrane. The cytoplasmic N and C termini are missing. The solid gray lines indicate the inner and outer limits of the membrane. C, view from inside the cell looking out. The panel shows how Domain-2 (Ser339, Ser342 (blue), and Tyr343 (orange)) form a narrow corridor that widens during opening. The distance between these residues is expected to increase further during pore dilation, which might lead to disruption of a low-affinity Ca2+ binding site.
