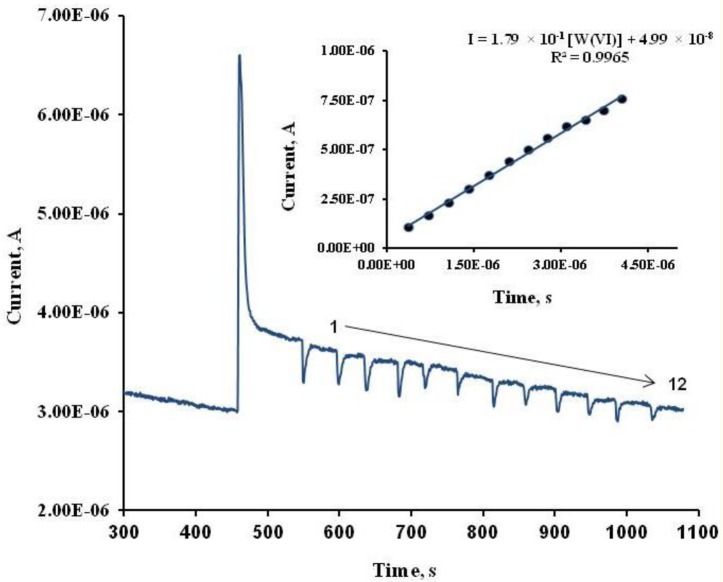
Figure 1.
Chronoamperogram registered using an ALP-based biosensor under the optimum conditions (applied potential, +0.20 V vs. Ag/AgCl SPE; supporting electrolyte pH 8.00 (Tris HCl buffer, 0.36 M total Cl−) and 2-phospho-l-ascorbic acid trisodium salt 0.32 mM, in the W(VI) concentration range from 3.0 μM to 30.0 μM. Inset figure, a calibration curve for twelve aliquot W(VI) additions under optimum conditions.

