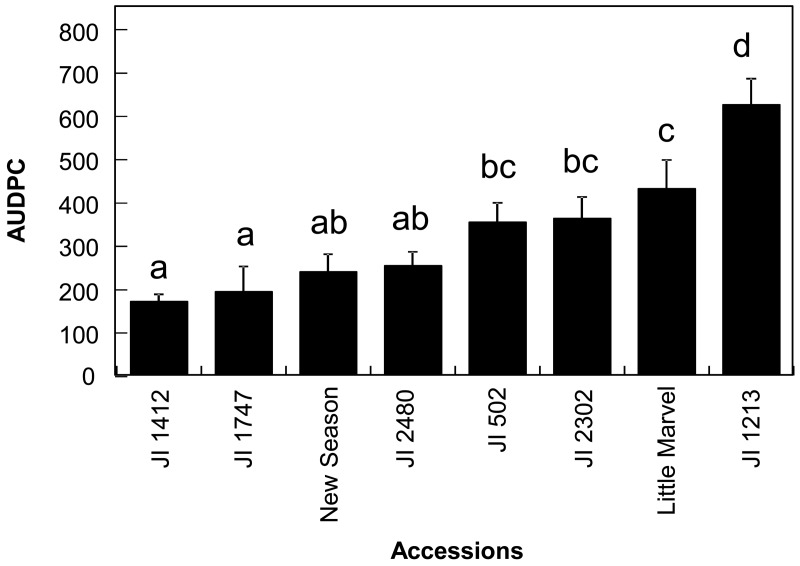
Figure 1.
Assessment of Fusarium oxysporum f. sp. pisi (Fop) disease symptoms in the selected Pisum sativum accessions. The histogram shows the area under the disease progression curve (AUDPC) calculated for each P. sativum accession from the periodic evaluation of Fop disease symptoms expressed as percentage of wilting leaves per plant. Vertical bars are standard errors for n = 10. Different letters between each histogram indicates significant difference between values according to Duncan multiple range test at α = 0.05.

