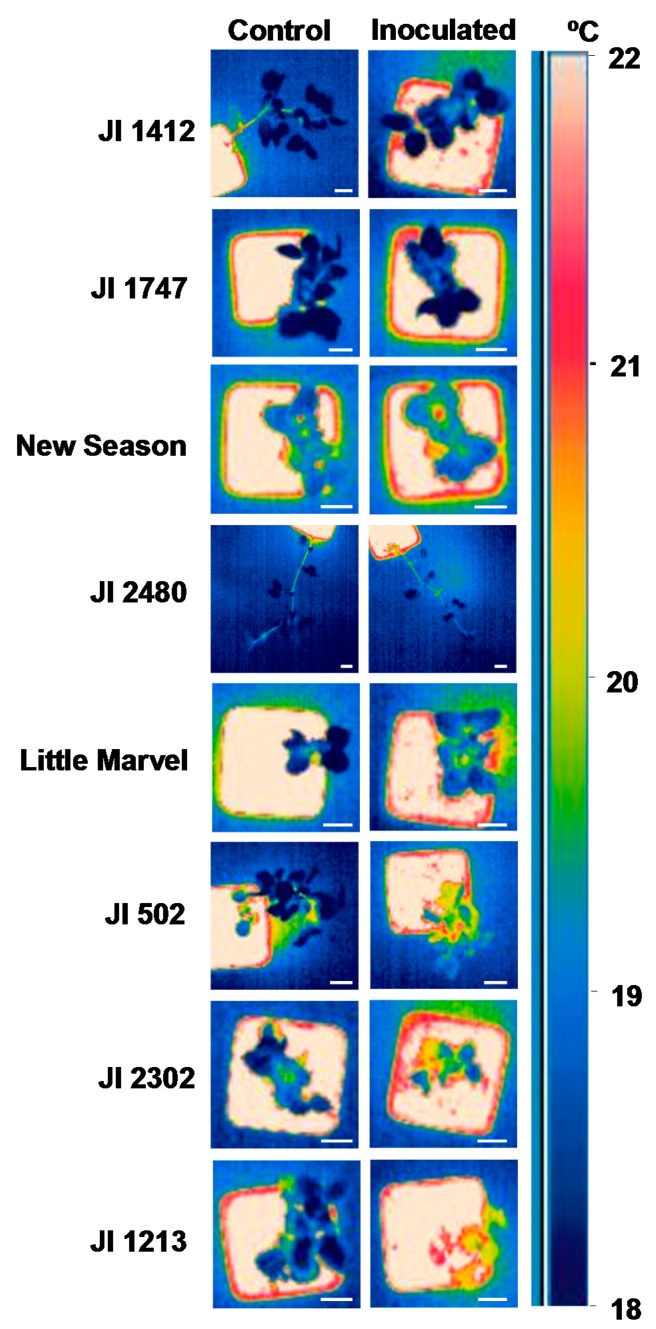
Figure 3.
Comparison of the surface leaf temperature between control and inoculated P. sativum plants with F. oxysporum f. sp. pisi (Fop) at 10 days post-inoculation. The figure shows a representative image of each accession maintained non-inoculated (Control, Left) and inoculated with Fop (Right). Scale bars indicate 2 cm.

