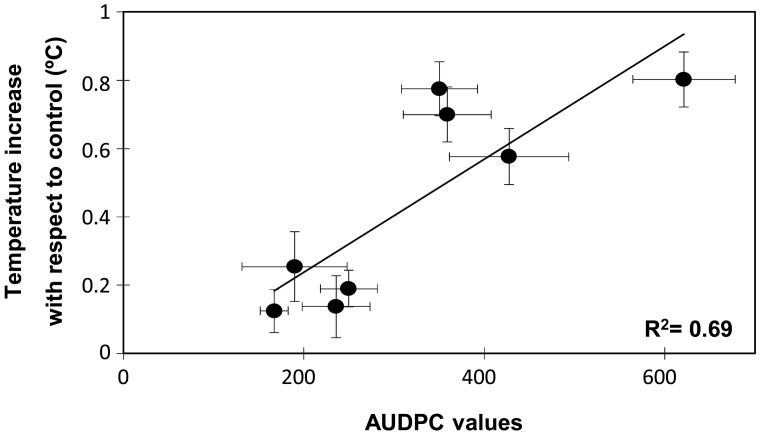
Figure 4.
Relationship between the level of susceptibility to F. oxysporum f. sp. pisi (Fop) and surface leaf temperature. The graphic represents the linear correlation calculated for the differences in surface leaf temperature detected for each P. sativum accession between inoculated and control plants at 10 days post-inoculation with Fop in relation with their corresponding AUDPC values. Horizontal bars are standard errors for AUDPC values with n = 10 while vertical bars are standard errors for the differences in surface leaf temperature calculated with n = 10.

