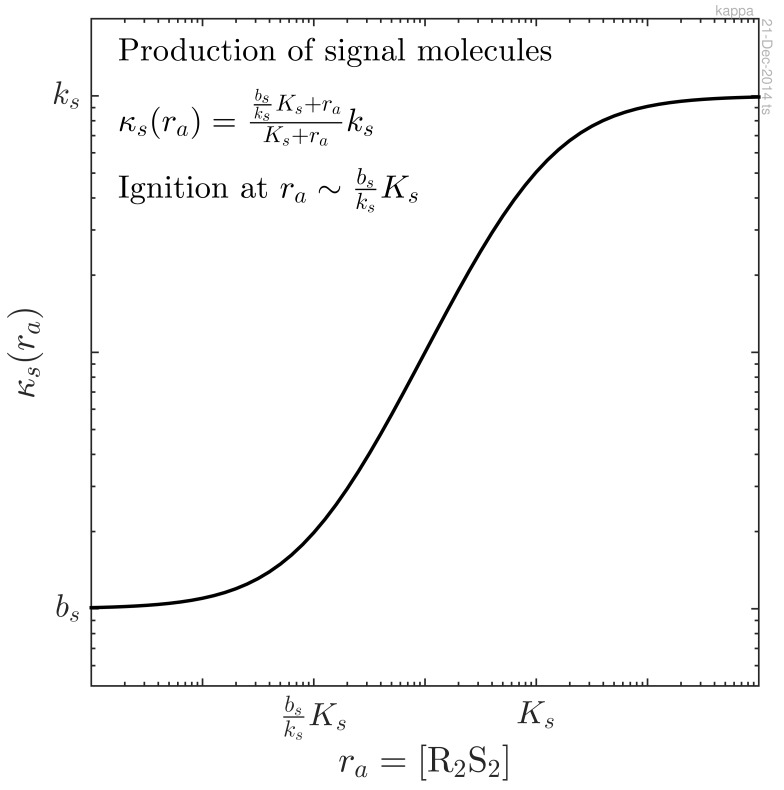
Figure 2.
Log-log plot of signal molecule production, κs, as a function of activated regulator concentration, ra = [R2S2]. The feedback loop ignites when the signal molecule production starts rising from the background level. Note that this point can be several orders of magnitude lower than the dissociation constant for the binding of R2S2 to the promoter. In this figure, an induction factor of ks/bs = 100 was assumed.

