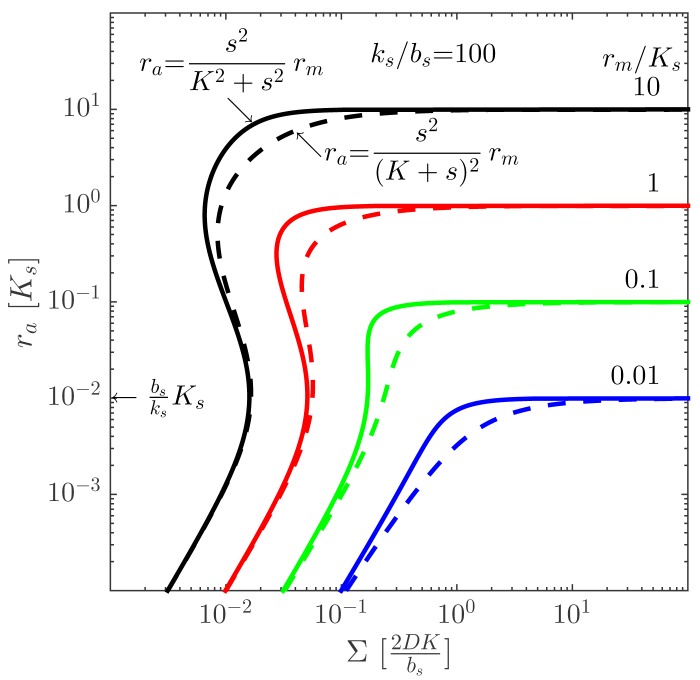
Figure 4.
Intracellular concentration of the activated regulator at the center of a bacterial colony as a function of the colony size. The full curves represent cooperative ligand binding, and the dashed curves represent independent binding. When rm > Ks, the hysteresis leading to a robust switch is present for cooperative ligand binding, as well as for independent binding. With cooperative binding, the switch is well defined at moderately lower rm values than obtained with non-cooperative binding. Adapted from [11]—published by The Royal Society of Chemistry.

