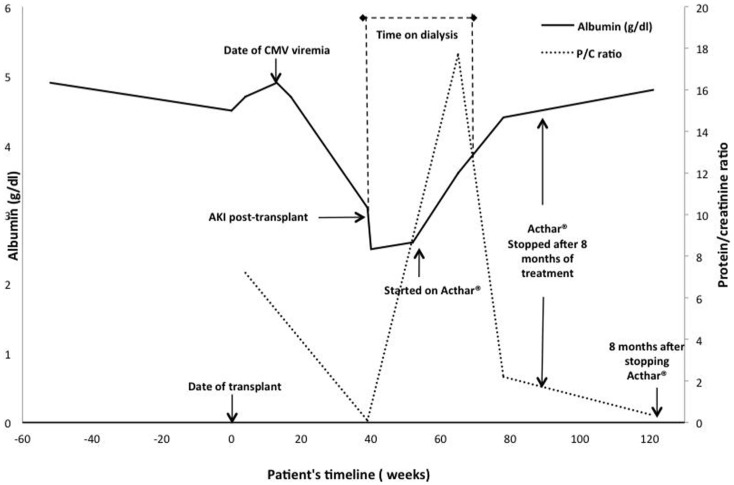
Figure 2.
Time course of events, treatments, and responses in serum albumin and urine protein excretion. The serum albumin level over time is depicted by the solid black line and the urine protein/creatinine ratio by the dashed gray line. The value at 40 weeks was imputed to be 0 because the patient was anuric.

