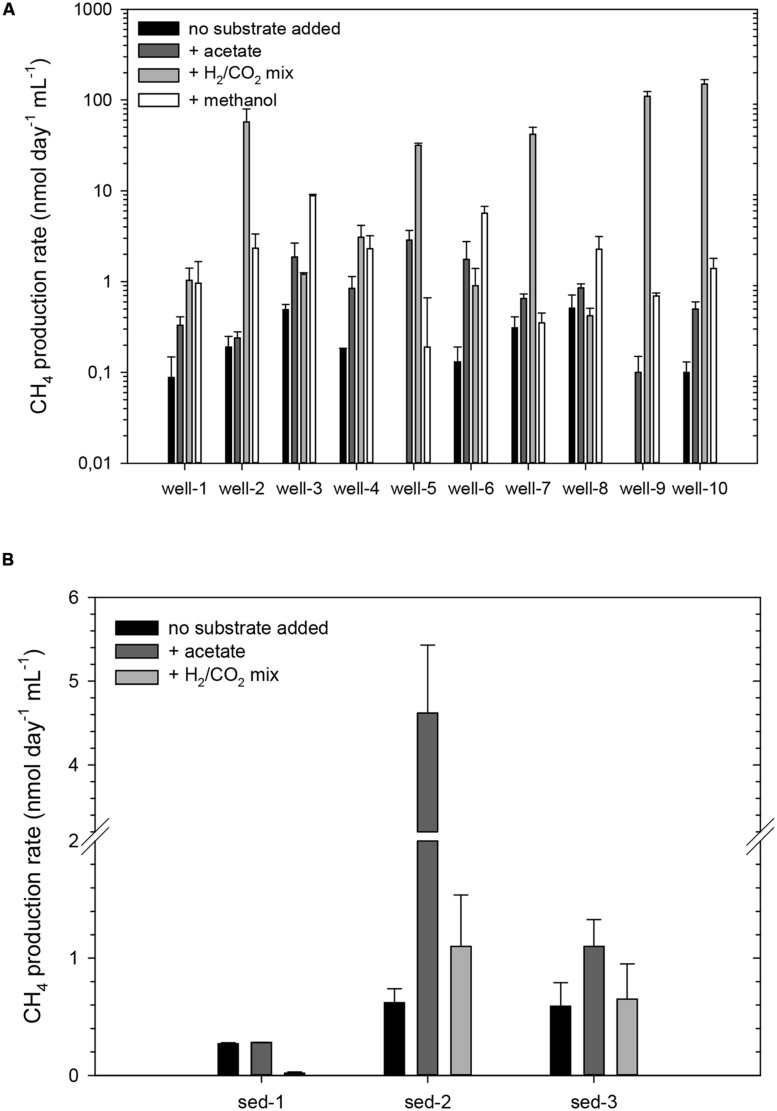
FIGURE 2.
Methane production rates from cultured groundwater samples from wells 1 to 10 amended without any additional substrate, or with either acetate, a mixture of H2 and CO2 or methanol (A), and from sediments 1–3 without any substrate added or amended with either acetate, or a mixture of H2 and CO2(B). Notice the different scale of the Y axis. The error bars represent the SD of three replicates. All cultures were incubated at 30°C for 73 days.

