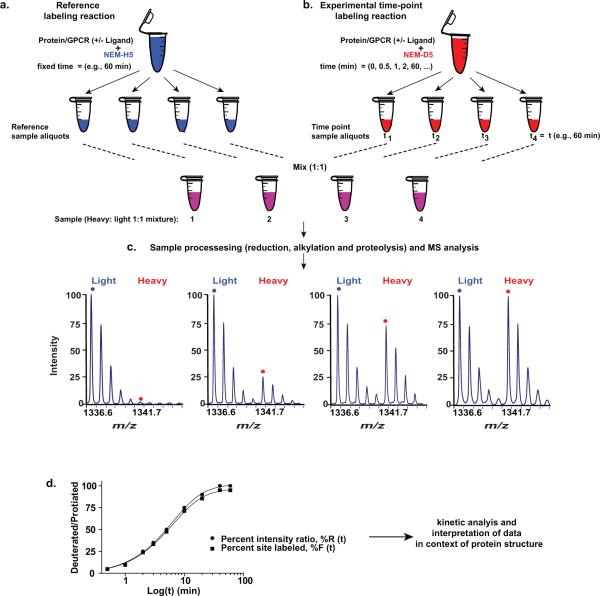
Figure 2. Overview of CDSiL-MS strategy designed to monitor conformational changes in proteins.
The procedure uses a functionally active, purified protein to quantitatively measure changes in the reactivity of residues to specific stable isotope reagents. (a-b) Labeling of cysteines is initiated in two purified protein pools (2.5 μM; bound to the same ligand; 30 min at 25 °C) by adding 2 mM of either NEM-H5 as in (a) or NEM-D5 as in (b). (a) Reference labeling reaction: reactions are performed for an hour at 25 °C (terminated by adding DTT) and equal sized aliquots are prepared. (b) Experimental time-point labeling reaction: exactly equal sized aliquots are withdrawn at different time points and quenched. (c) Sample processing (reduction, alkylation and proteolysis), and MS analysis: equal amounts of the two pools are mixed, reduced, alkylated, subjected to proteolysis with appropriate enzyme, and MS analyzed to determine peptide fragments that have been modified. The sample time course spectra of singly charged ion ([M+H]+) peak pairs for a peptide modified at cysteine by NEM (H5 and D5) is shown. (d) Sample plot (black circles) of change in the intensity ratios (%R) between peptide signal intensities containing heavy and light reagents over time. Each percent intensity ratio (%R) data point is corrected by a specific site reactivity ratio (Rr) to obtain percent site labeled (%F) as represented by the curve (black squares) for the percent intensity ratios (%R) plot.

