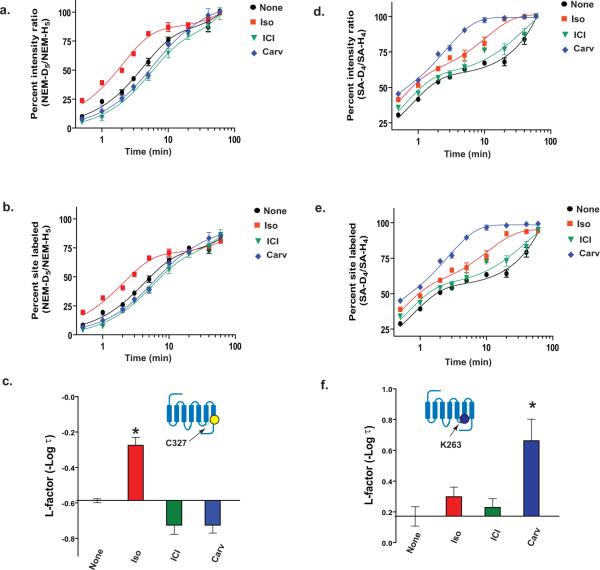
Figure 6. CDSiL-MS based strategy in measuring functional residue-specific conformational rearrangements in β2AR.
Time-course curves for the extent of NEM reactivity at C327 (a) and SA reactivity at K263 (d) expressed as percent intensity ratio plotted vs. labeling time (%R (t)) on a logarithmic scale, for unliganded (black circles), iso (red squares), ICI (green triangles) or carv (blue diamond). (b, e) Same labeling curves expressed in the form of percent of sites labeled, %F (t) following normalization of %R (t). Bar graphs summarizing the effects of each ligand on the changes in the L-factors of the C327 (c) and K263 (f) on the β2AR, expressed relative to the unliganded receptor. Inset indicates position of labeled residue in the β2AR snake like diagram. Data correspond to the means ± standard errors from at least three independent experiments. Asterisk indicates statistical significance (*p < 0.05) compared to control receptor alone by one-way ANOVA.

