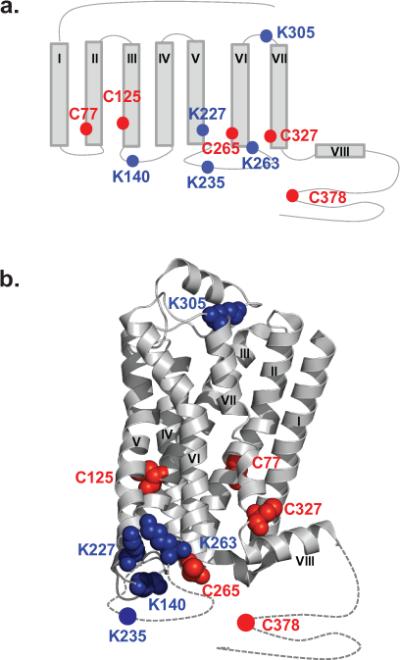
Figure 7. Multiple β2AR residues from different structural elements that can be monitored using CDSiL-MS strategy.

Cartoon (a) and ribbon (PDB: 3SN6) diagram (b) of the β2AR, showing locations of Cys (red) and Lys (blue) residues for which reactivities can be monitored. In (b), the Cys and Lys residues shown in sphere format are the ones that are available in the X-ray crystal structure. Dotted lines indicating highly flexible regions of the receptor which are absent in the X-ray crystal structure.
