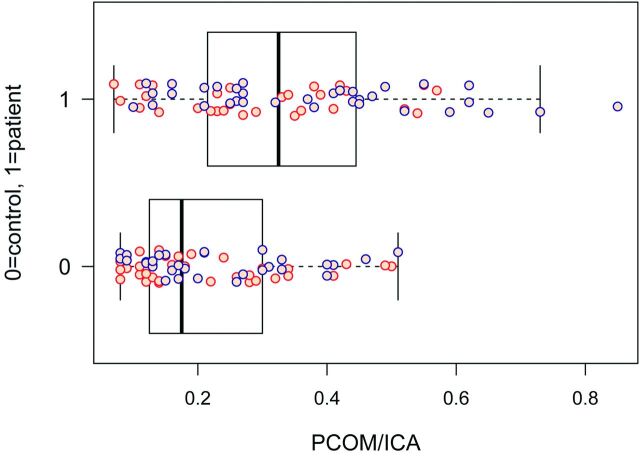
Fig 3.
PcomA/ICA ratio in subjects with MMD versus control subjects by hemisphere. The PcomA/ICA ratio in a patient with MMD (n = 1) was significantly higher (P < .001) compared with control subjects (n = 0). Orange dots are observations for the left cerebral hemisphere, and blue dots are for the right cerebral hemisphere. The dark band represents the median in this boxplot.

