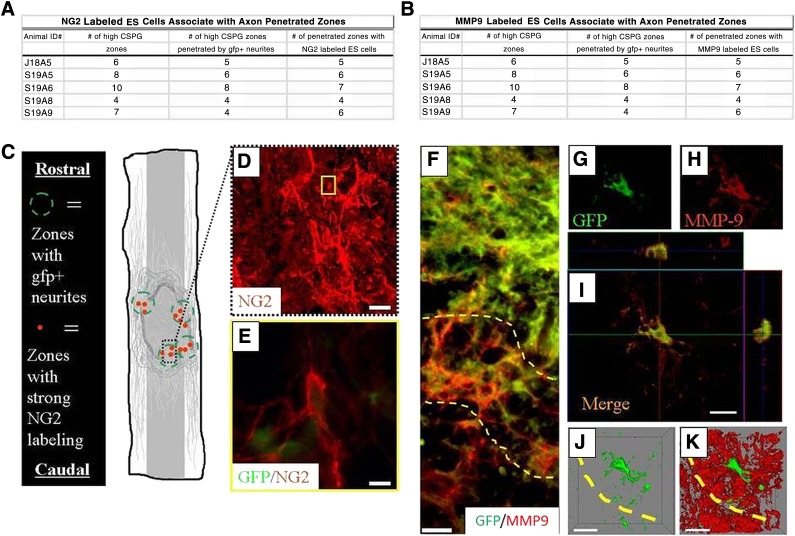
Figure 6.
After being transplanted into the contused adult rat spinal cord, ES cells expressed NG2 in zones of high CSPG expression. (A, B): The cavity displayed intense zones of the highest CSPG expression (as determined by consistent, low-power epifluorescent imaging), zones penetrated by axons, and zones infiltrated with transplanted ES cells showing NG2 immunoreactivity. (C): Schematic illustration of zones of high CSPG expression that contain NG2+ ES cells penetrated by axons (green dashed circles represent high CSPG zones penetrated by GFP+ neurites, and red solid dots indicate penetrated zones populated with numerous NG2 labeled cells). (D): Midpower image demonstrating strong NG2 expression located at the graft/cyst cavity border. (E): Image corresponding to yellow box inset in (D), demonstrating an individual transplanted NG2+ cell colabeled with GFP passing through graft/cyst zones. Scale bars = 10 μm. ES-derived neural progenitors displayed MMP-9 immunoreactivity in zones of high CSPG expression after being transplanted into the contused adult rat spinal cord. Inset: The cavity displayed a profile similar to that of NG2+ labeled zones, demonstrating consistent labeling of MMP-9 where axons penetrated. (F): MMP-9 was expressed in diffuse patterns at the glial scar boundary (demarcated by dashed yellow lines; GFP, green; MMP-9, red). (G, H): A GFP+ transplanted ES cell (GFP, green [G]) colocalized with MMP-9 expression (CS-56, red [H]) at the graft/cyst cavity border (dashed yellow line). (I): Three-axis view of merged images represented in (G) and (H). Orthogonal views of this image are outlined in green and red and are represented within the confocal image (I) with their respective lines. (G, H): Reconstructed three-dimensional images of the same transplanted ES cell-derived neural cells shown in (J) and (K), demonstrating the extent of MMP-9 expression to a single cell in vivo. Transplanted cells shown here were derived from the B5 GFP ES cell line. Scale bars = 20 μm (D), 10 μm (E–I). Abbreviations: CSPG, chondroitin sulfate proteoglycan; ES, embryonic stem; gfp or GFP, green fluorescent protein; MMP9, matrix metalloproteinase 9; NG2, nerve glial antigen 2.

